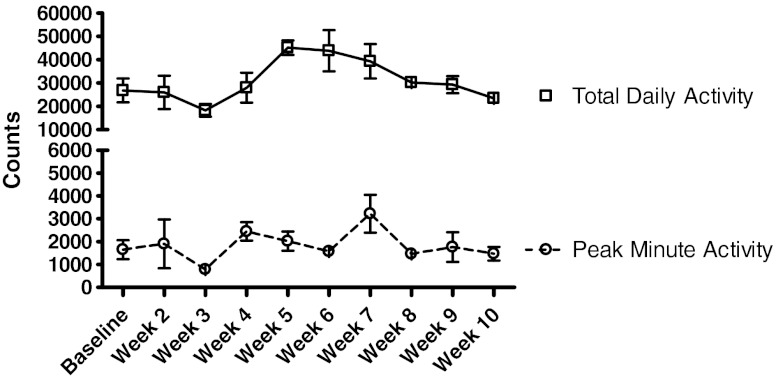
Fig. 3.
Physical activity. Total daily activity was averaged for each week during 10 weeks of observation. Peak activities shown are the means of the highest activity recorded during a single minute within each day of the week. Data from days with incomplete data collections (<10,000 counts/day) were excluded from analyses

