FIG. 4.
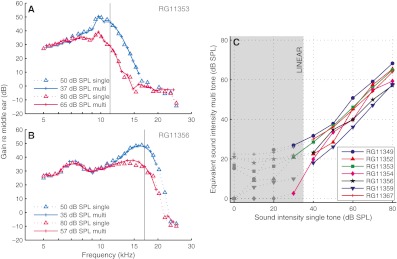
Similar frequency tuning of single-tone and multitone responses. A, B For two experiments, two isointensity single-tone responses and their equivalent-level multitone responses are shown. Vertical black lines mark CF. CF = 11.2 (A) and 17.0 (B). C Relation between single-tone SPL and equivalent multitone SPL for seven ears. The low SPL, linear range is marked by gray markers, dotted lines, and a gray area.

