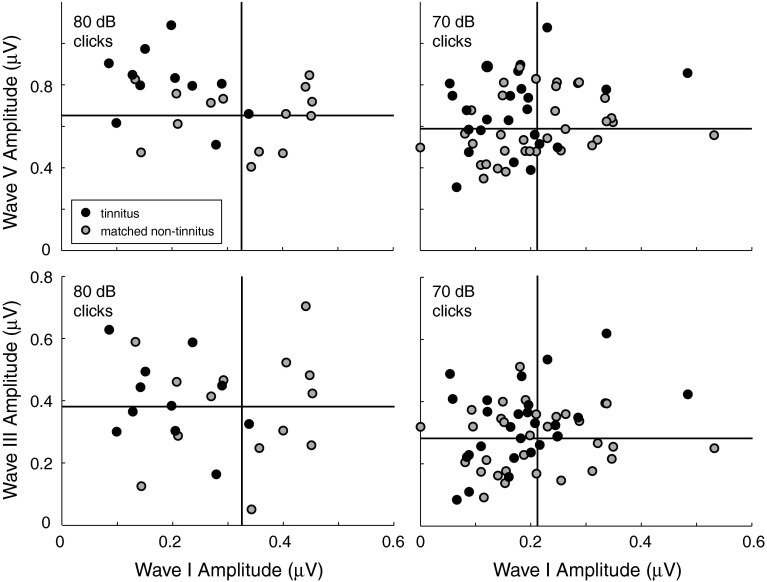
FIG. 4.
Individual data showing waves V (top) and III amplitudes (bottom) versus wave I amplitude for two stimulus levels, 80 (left) and 70 dB nHL (right). Tinnitus and matched non-tinnitus subjects are the same as those in Figure 3. Each point corresponds to ABR data for a given subject and stimulated ear. Vertical and horizontal lines indicate mean wave I amplitude and mean wave V (top row) and III (bottom row) amplitudes, respectively, for the matched non-tinnitus subjects.

