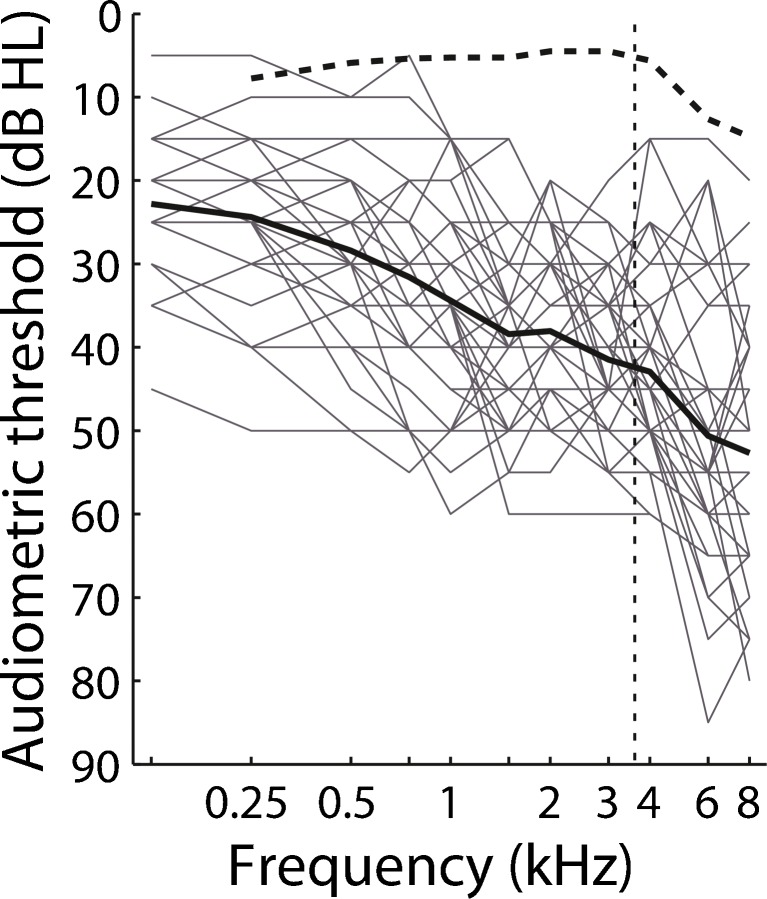
FIG. 1.
Pure-tone audiograms for the tested (i.e., right) ear of the 41 HI listeners. The bold continuous line shows the mean audiogram of the 41 HI listeners. The bold dashed line shows the mean audiogram of the NH listeners. The vertical thin dashed line shows the high cutoff frequency (3.6 kHz) of the speech stimuli used in the present experiment.

