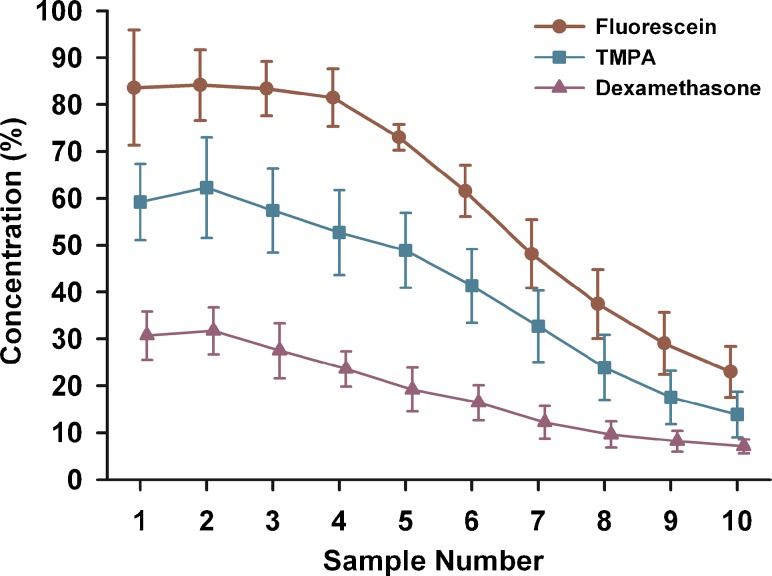
FIG. 7.
Mean curves for three substances measured by sequential sampling with a 120 min delay after a 60 min injection into the LSCC. Concentrations were normalized with respect to the measured concentration of the injected solution in each experiment. Fluorescein shows the highest curve, showing it is eliminated most slowly from the cochlea. Dexamethasone (mDex) shows the lowest curve, indicating it is eliminated most rapidly from the cochlea. The TMPA curve falls at an intermediate level.

