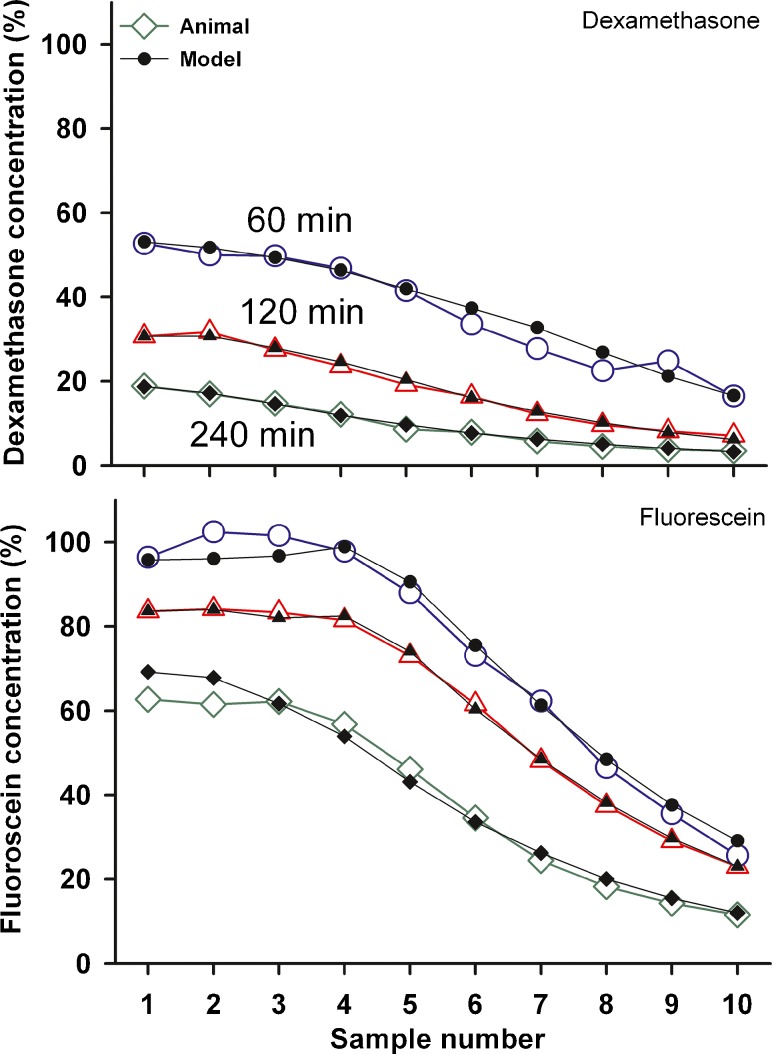
FIG. 8.
Determination of kinetic parameters by computer simulations of the experiments. Open symbols: Mean sample curves for mDex (upper panel ) and Fluorescein (lower panel) at three delay times after injection, fitted by computer simulations, shown by solid symbols. The parameters used to fit the curves are given in Table 1.

