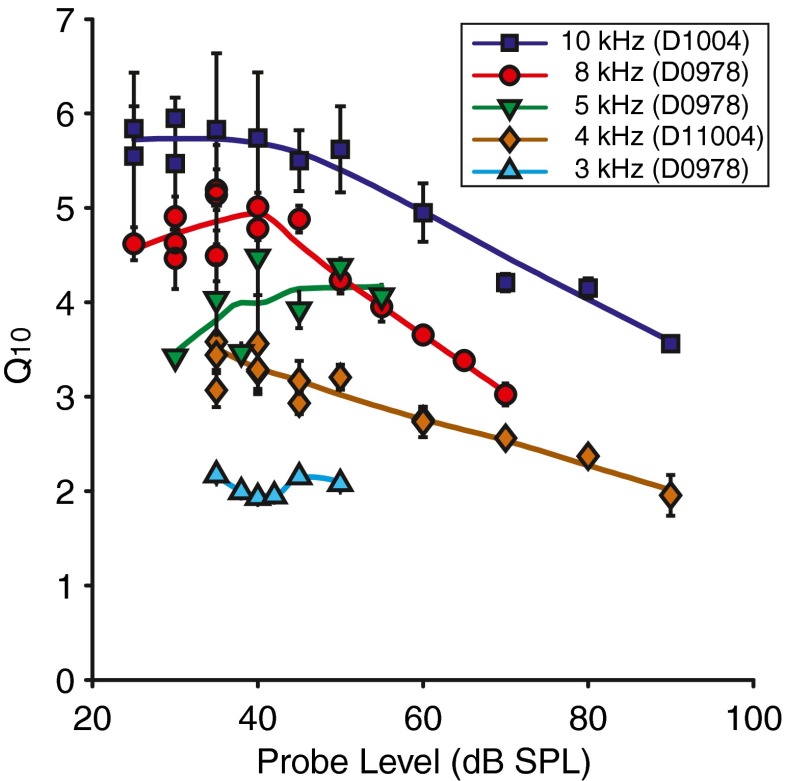
FIG. 11.
Dependence of Q 10 factors on probe level for different probe frequencies in cat. Repeated measurements are shown separately; the error bars indicate the standard error of the estimate for regression (SEE). The lines are smoothed trend lines through the scattered data (the trend is obtained with a RLOWESS function and smoothed with a cubic spline interpolation (MATLAB)). All results were obtained with the fast method.

