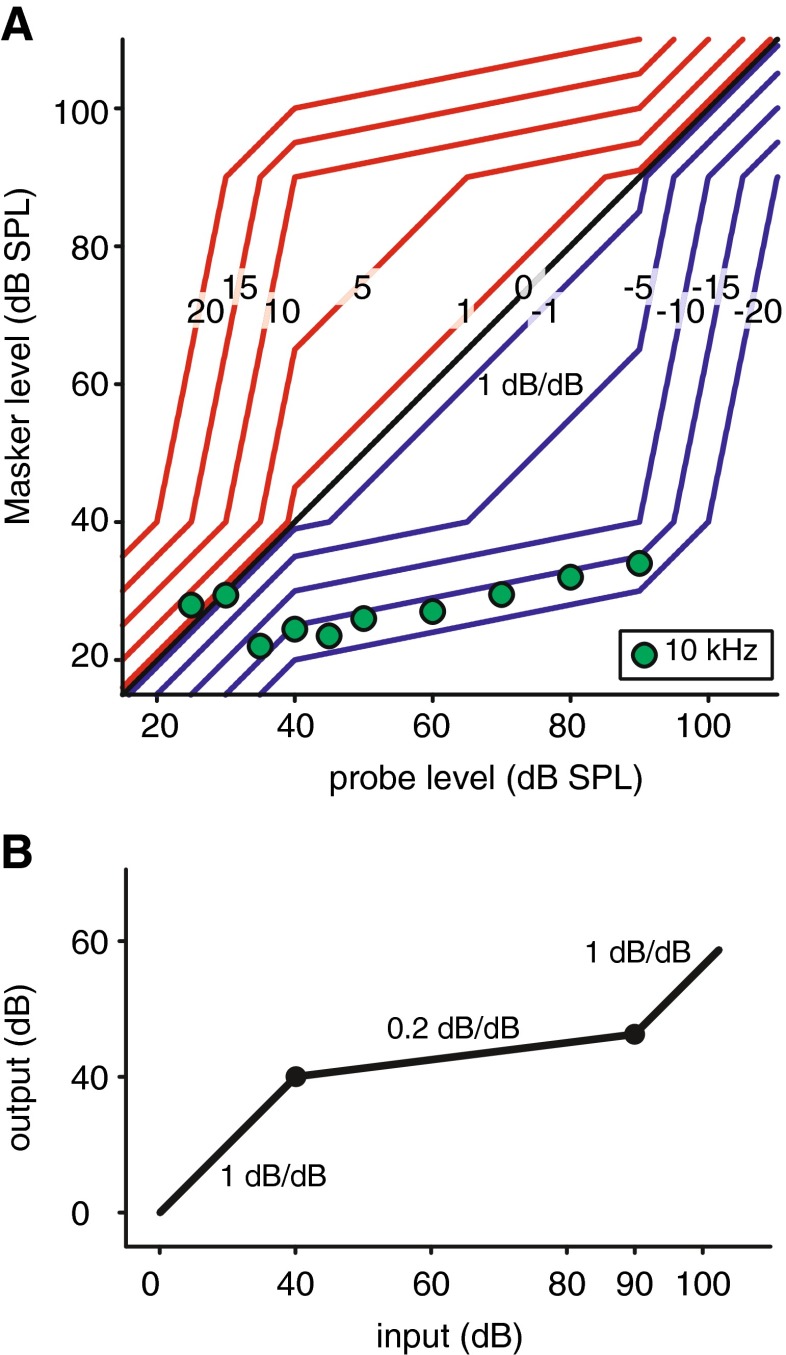
FIG. 13.
Illustration of the influence of cochlear compression on the GMB. A Simulated GMB curves for different masking conditions. The simplified model assumes that (1) the probe and masker input levels are subject to the same I/O curve (B); (2) masking is a linear operation; and (3) the masking criteria are proportional to the ratios of the excitation patterns (power) from masker and probe. These ratios, in decibel, are indicated on the curves in A. As comparison, the data points of the GMB in Figure 12 for a probe frequency of 10 kHz are included; the resemblance in absolute values is only a coincidence. B The BM I/O curve (log-log scale) used in the model. The compression coefficients (slopes) and cut-off points (40 and 90 dB) are chosen as suggested values.

