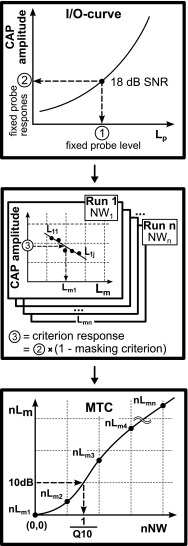
FIG. 2.
Schematic representation of the procedure for constructing MTCs. From an I/O curve, a fixed probe level ①and corresponding response ② were chosen. Subsequently, a criterion response amplitude ③ is calculated by applying the masking criterion to the fixed probe response ②. Masked probe responses from a varying masker level (L 11, L 12, …, L 1j) are then obtained for consecutive runs with increasing notch widths. For every run, simple linear regression is applied on the masked probe responses to determine the masker levels (L m1, L m2, …, L mn) resulting in the criterion response ③. Finally, the MTC is estimated with polynomial (linear) regression and Q 10 is extracted.

