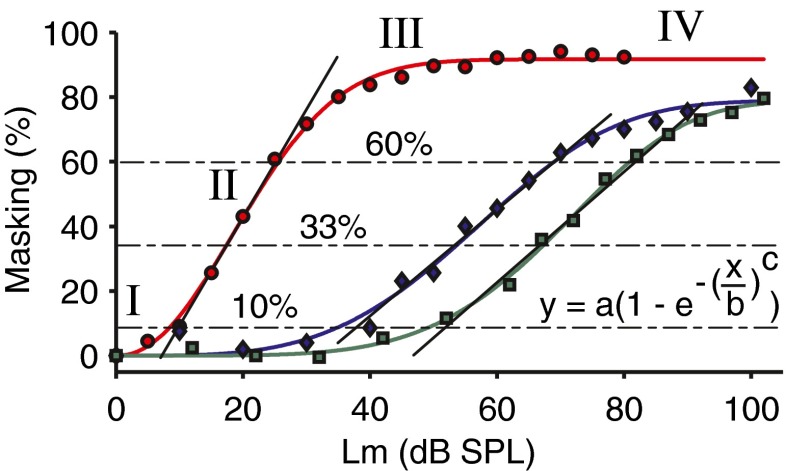
FIG. 5.
Masking intensity curves, amount of masking as a function of masker level, for different conditions in two different cats. The masking curves are fits of cumulative Weibull distribution functions (formula included in the figure). The conditions for the curves are, from left to right: red-filled dots, L p = 40 dB SPL, f p = 10 kHz, nNW = 0, a = 91.68, b = 24.89, c = 2.129, animal 1; blue diamonds, L p = 67 dB SPL, f p = 2 kHz, nNW = 0.44, a = 78.89, b = 62.62, c = 3.668, animal 2; and green squares, L p = 60 dB SPL, f p = 6 kHz, nNW = 0.34, a = 78.72, b = 75.29, c = 5.031, animal 2. Four different regions can be identified: I, region with almost no masking; II, region with a steep linear growth (on semi-log plot, solid lines), i.e., between ~10 and 60 % masking (upper and lower horizontal dashed dotted lines); III, transition region with a much smaller growth; and IV a region clipped to maximal masking. The middle of region II is the best region for the masking criterion, chosen at ~33 % (middle horizontal dashed dotted line).

