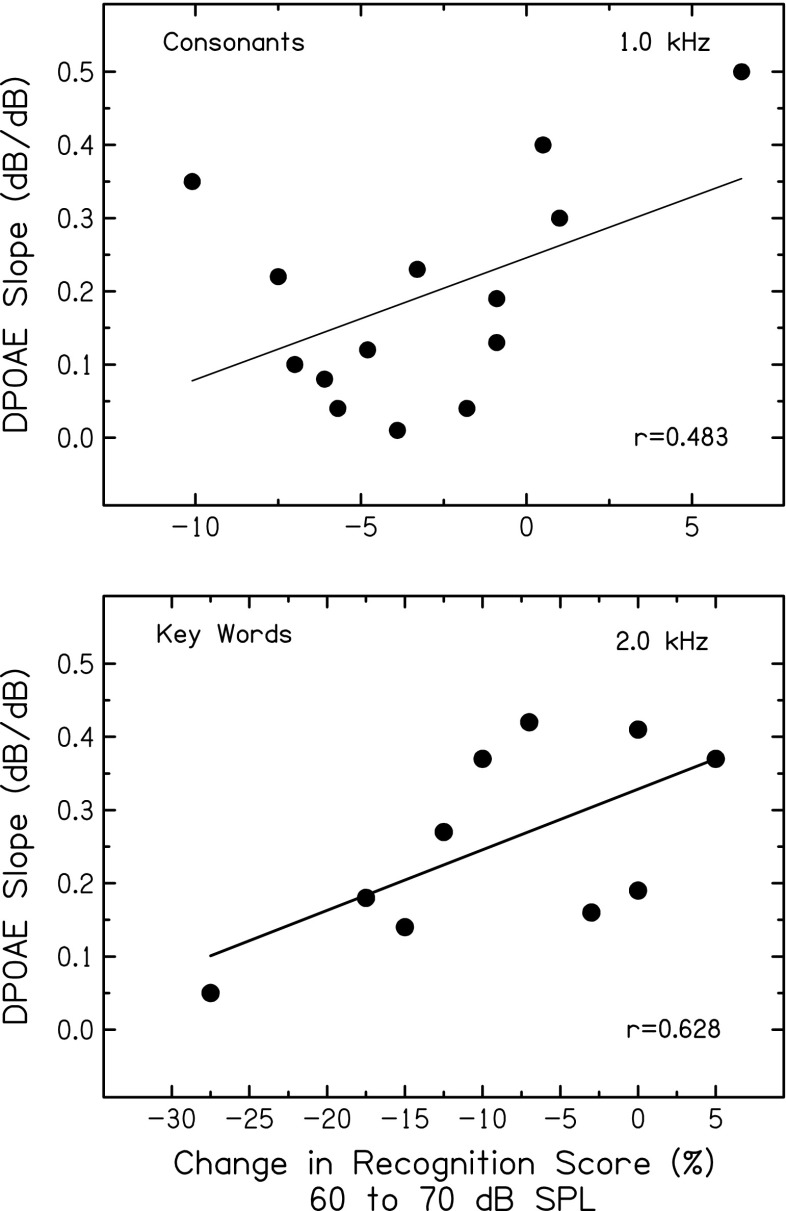
FIG. 9.
Top: Slopes of DPOAE input–output functions for an f 2 of 1.0 kHz plotted against the change in consonant recognition scores with speech level increasing from 60 to 70 dB SPL. Bottom: slopes of DPOAE input–output functions for an f 2 of 2.0 kHz plotted against the change in key word recognition scores with speech level increasing from 60 to 70 dB SPL. Pearson correlation coefficients and linear regression functions are included in each panel.

