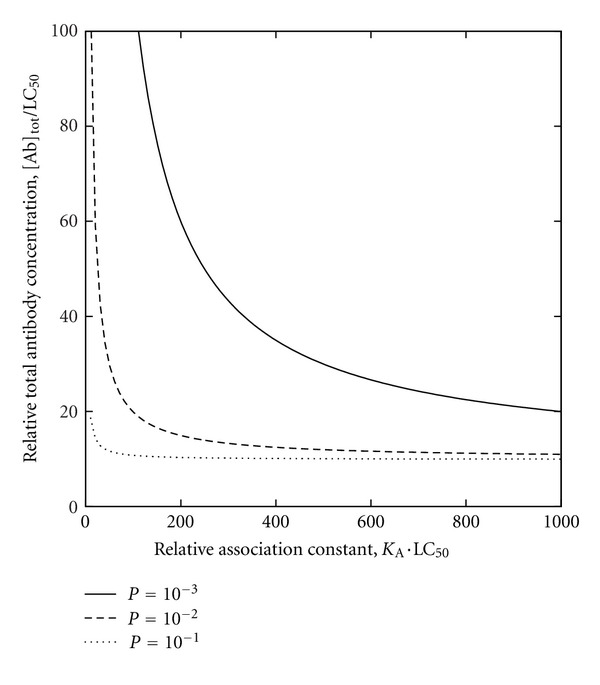
Figure 5.

Contour map based on dose-response relationships of Figure 4 for [Tx]tot/LC50 = 10 (i.e., total toxin concentration tenfold greater than LC50), depicting P as a function of both antibody affinity (expressed in terms of the association constant K A; cf. (1)) and antibody concentration (i.e., minimum required antibody concentration of Figure 6).
