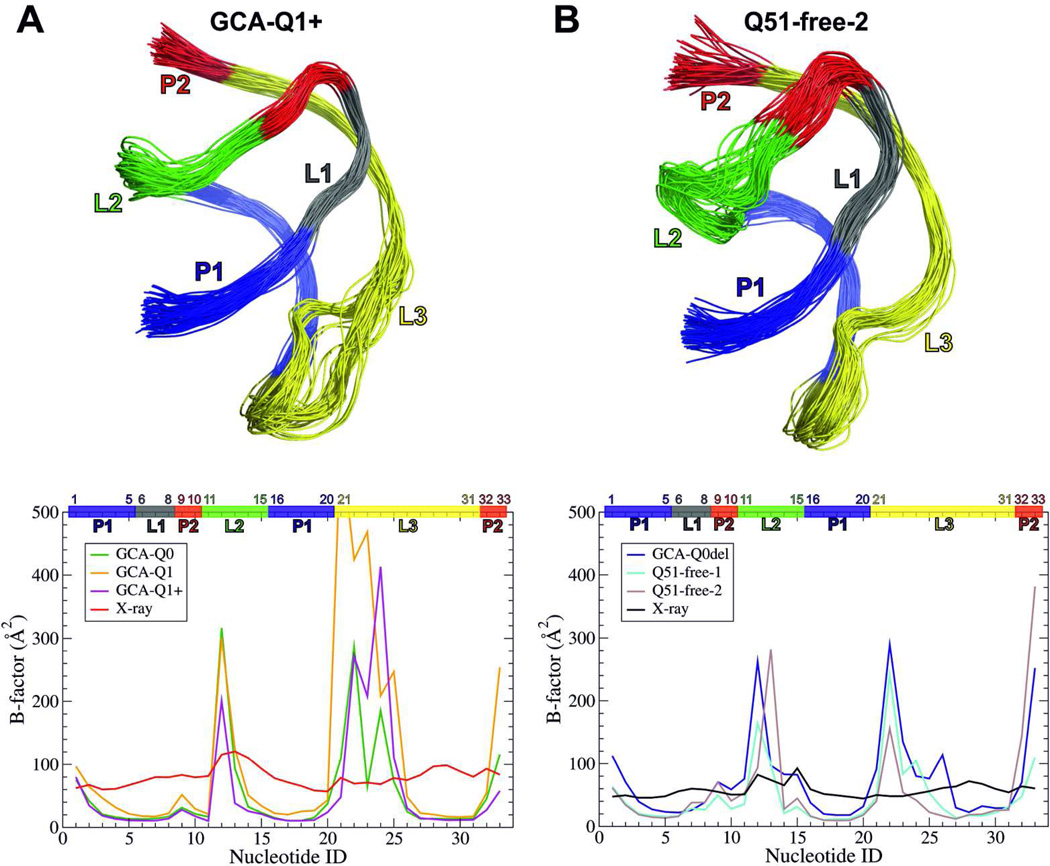
Figure 5.
The upper part shows the superposition of the snapshots of the preQ1 riboswitch aptamer taken from A) GCA-Q1+ (ligand-bound) and B) Q51-free-2 (ligand-free) simulations, showing the rigid and flexible regions of the aptamer in each functional state. The lower part documents corresponding thermal B-factors of each aptamer’s residue. In red and black are colored B-factors derived from the X-ray structures of ligand-bound (PDB ID 3GCA) and ligand-free (PDB ID 3Q51) PQA, respectively. The simulations are indicated top left. The coloring of the stripes at the top of each panel matches the colors of the stems and loops shown in Figure 1.

