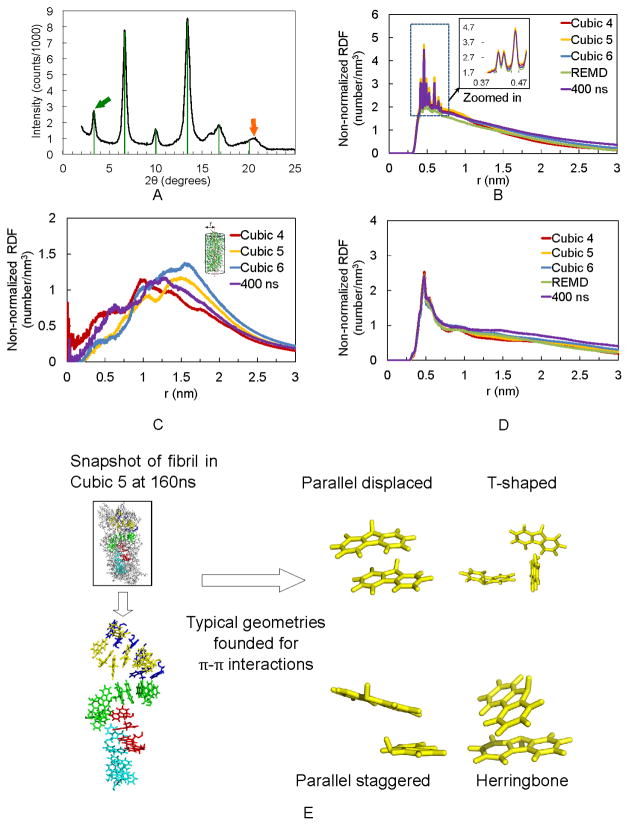
Figure 3.
WAXS experiments confirm non-normalized RDF calculations. (A) WAXS diffraction pattern for Fmoc-AA gel film shows strong reflection (green arrow) and higher order reflections (green lines) corresponding to a d-spacing of 26.3 Å (n=1). Orange arrow indicates a reflection with d=4.35 Å. (B) Last 50 ns non-normalized RDF plot of distance between fluorenyl rings of Cubic 4, 5, and 6, REMD and the 400 ns simulations. (C) Last 50 ns non-normalized RDF plot of distance between terminal alanine’s hydroxyl hydrogen and fibril axis. (D) Last 50 ns non-normalized RDF plot of Fmoc-AAs’ strand-to-strand distance, showing predominance of a 0.46–0.48 nm (4.6–4.8 Å) distance between adjacent dipeptides. (E) Representative snapshot taken from Cubic 5 MD simulation displays the π-π stacking in fibril after 160 ns simulation.

