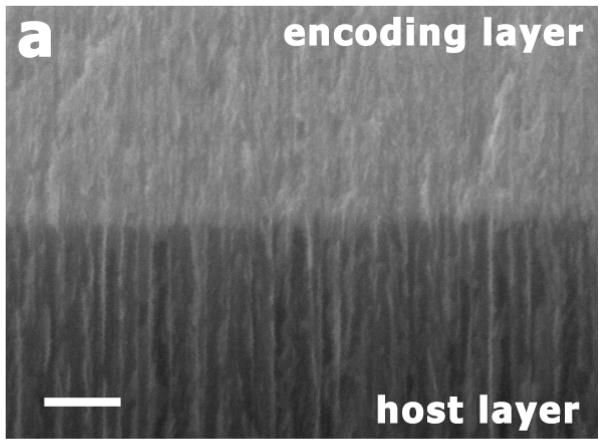
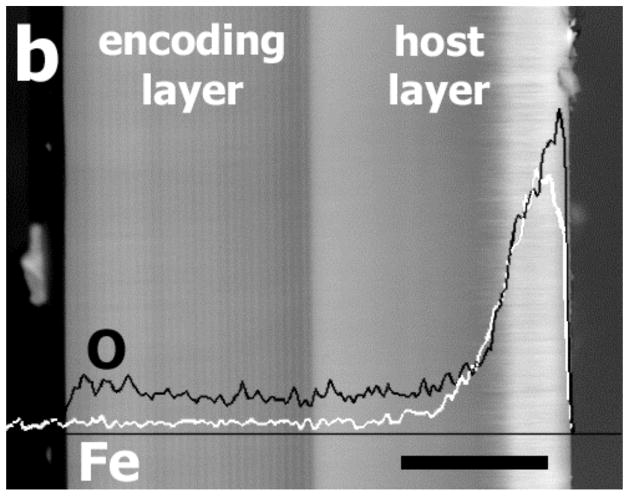
Figure 2.
Cross-sectional scanning electron micrographs of a magnetite-infused porous Si microparticle (“one-peak” preparation). (a) Secondary electron image of the interface between the encoding and the host layers. The encoding layer is prepared with a lower etching current (11.3–56.8 mA/cm2), and possesses smaller pores than the host layer, prepared at a higher current density (303 mA/cm2). Scale bar is 200 nm. (b) Back-scattered electron image with EDS line scan superimposed, showing the distribution of magnetite (iron oxide) in the particle. The black line in the image represents oxygen and the white line represents iron element maps. Scale bar is 20 μm.


