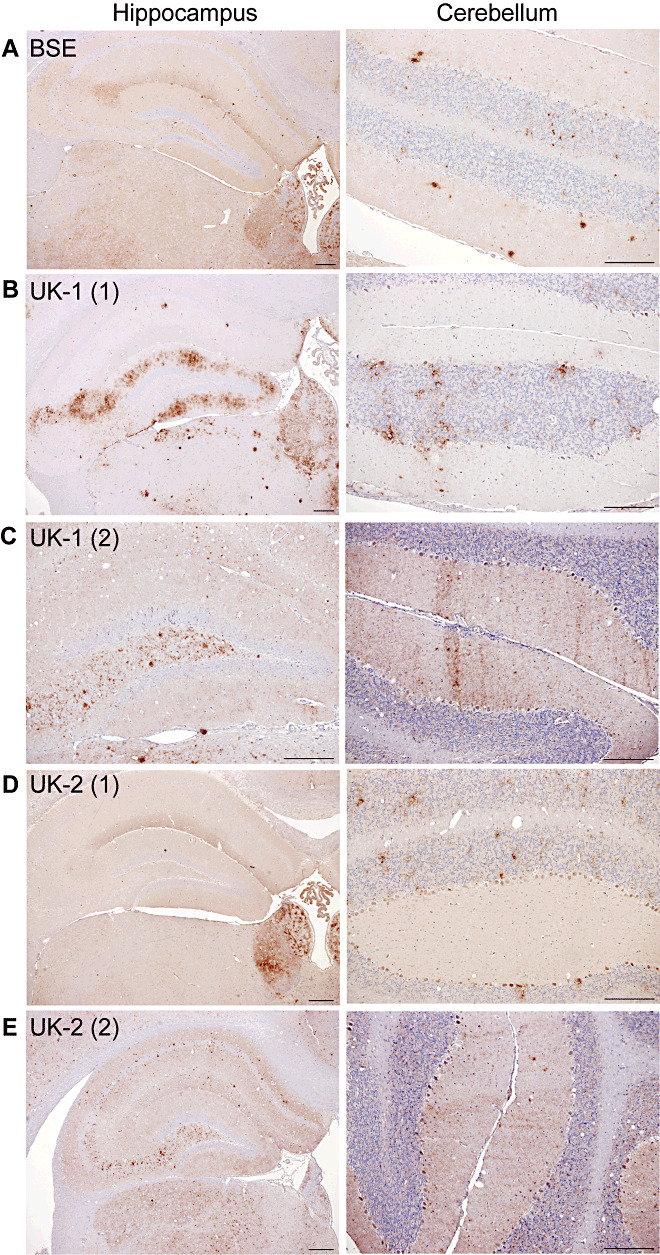
Figure 3.

PrPSc deposition patterns of UK‐1 and UK‐2 following transmission to C57BL mice. Representative photographs of PrPSc deposition in the hippocampus and cerebellum are shown for BSE (A). UK‐1 and UK‐2 each gave two distinct patterns as shown, termed UK‐1 (1) (B), UK‐1 (2) (C), UK‐2 (1) (D) and UK‐2 (2) (E), respectively. Scale bars represent 100 µm.
