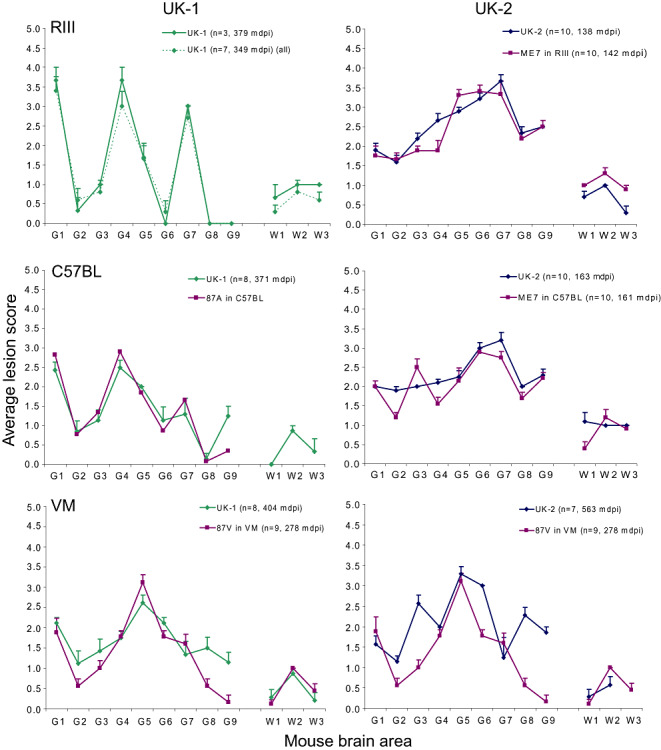
Figure 6.

LP following sub‐passage of UK‐1 and UK‐2 in wild‐type mice. Lesion profiles (LP) of UK‐1 and UK‐2 at second passage in RIII, C57BL and VM mouse lines are shown plotted alongside reference classical scrapie strains. Where less than five clinically and histopathologically positive mice were available, separate profiles, representing all haematoxylin and eosin (H&E)‐positive mice (dashed line) and mice that were both clinically and H&E positive (solid line) are plotted. Error bars indicate standard error of the mean. The numbers of animals that contributed to each profile and the IP (mean days post inoculation) for each profile are given in parentheses. The 87A in C57BL profile was reproduced from Fraser and Dickinson (23).
