Fig. 2.

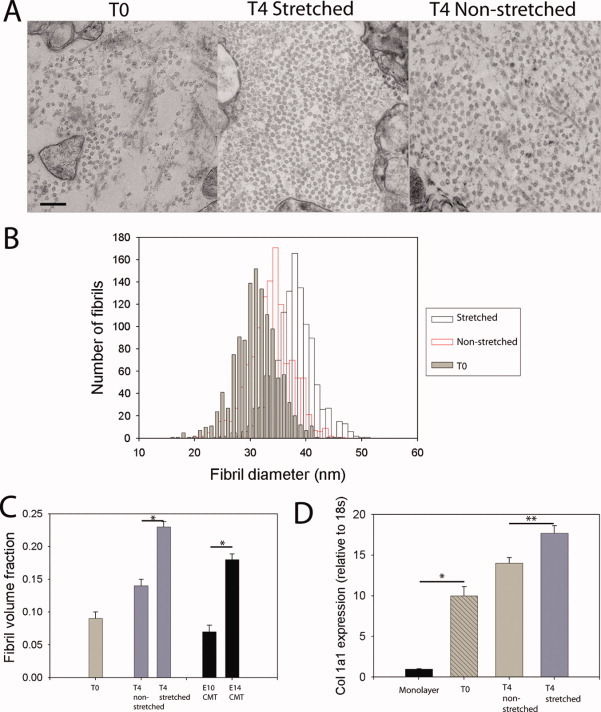
Effect of slow stretching on collagen matrix formation. A: TEM images at T0 and after four days with and without stretching. Collagen fibrils arranged in parallel can be seen in stretched and non-stretched samples. Scale bar = 250 nm. B: A fibril diameter histogram. Fibrils in the stretched construct show a shift toward increased fibril diameter (n=1,060 fibrils measured in each sample). C: Fibril volume fraction (FVF) increased between T0 and T4 in the non-stretched construct. However, the increase in FVF was greater after stretching. Values for day-10 and -14 ECMT are shown for comparison. D: Placing tendon cells in the fibrin gel (a 3D environment) resulted in significant up-regulation of col1a1 expression at T0. Expression was further increased post-formation (between T0 and T4, P < 0.001). This change was more pronounced after stretching (P < 0.01). *P < 0.001, **P < 0.01. For TEM a minimum of two samples was examined for each condition; for qPCR three constructs were pooled and one experimental repeat performed. Error bars represent standard error of the mean.
