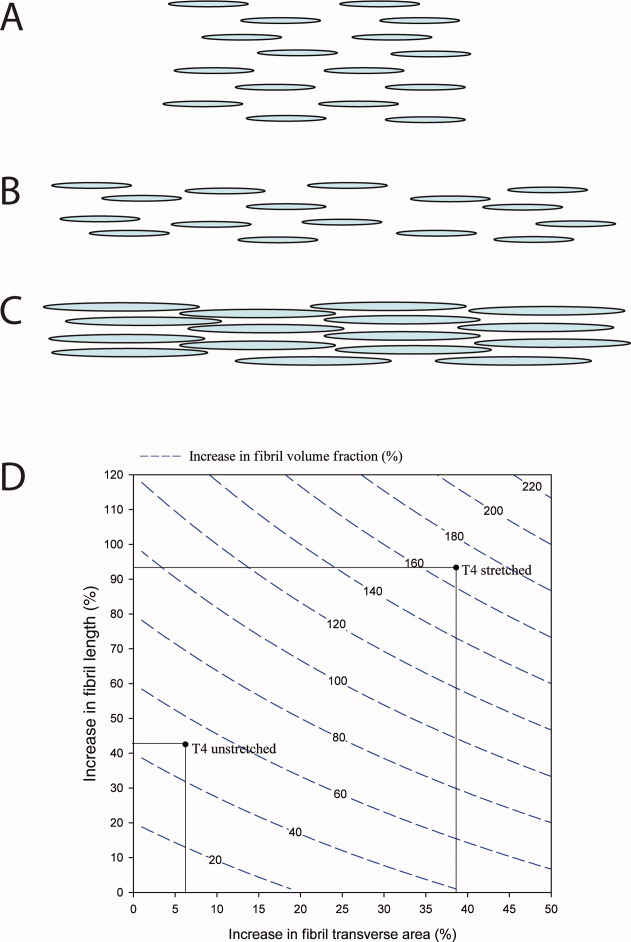
Fig. 4.

Model of the effect of stretching on fibril volume fraction. A–C: The effect of stretching the construct is shown schematically in 2D. A: An array of uniform collagen fibrils are shown. This array is extended in length in B while maintaining the fibril number, diameter, length, and volume fraction. C: The fibrils from the extended array are shown with increased diameter and length, both of which contribute to a higher fibril volume fraction. D: The predicted increase in fibril volume fraction is shown in the contour plot as a function of increases in fibril transverse area and fibril length. Two points (T4 non-stretched and stretched) are marked corresponding to the experimental fibril diameter and volume fraction data. There is a predicted increase in fibril length due to the stretching of the tendon construct as well as the directly observed increase in fibril transverse area.
