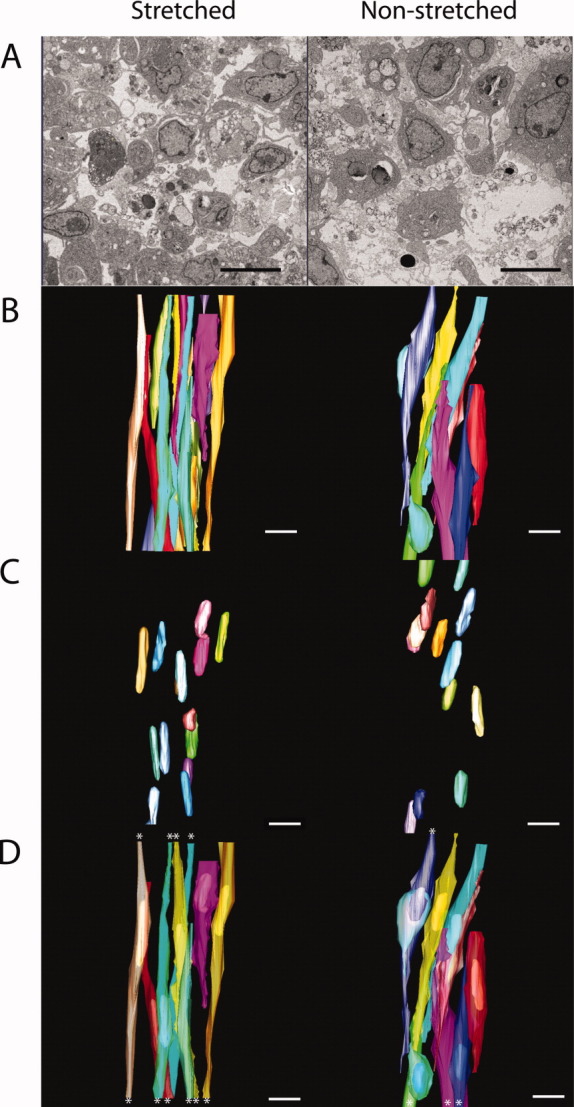
Fig. 5.

3D reconstructions of stretched and non-stretched constructs. A: A sample inverted back-scattered image. Scale bars = 5 μm. B: 3D reconstruction of cell plasma membranes demonstrates greater longitudinal cellular alignment in the stretched constructs. C: 3D reconstruction of cell nuclei. Measurements demonstrated elongation of nuclei in the stretched sample with no change in nuclear volume. These data are summarised in Table 1. D: Merged image of B and C. Cell plasma membranes (semi-transparent) and nuclei are shown. Stars mark cells that leave the 3D volume. Scale bar = 5 μm in A, 10 μm in B–D.
