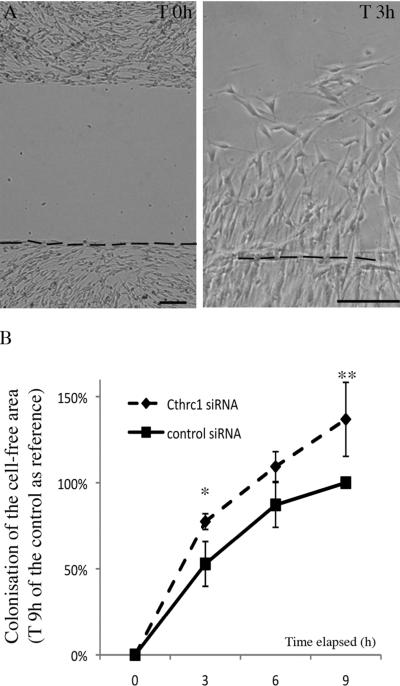
Figure 2. Cthrc1 knock-down promotes cell migration.
John Wiley & Sons, Inc.
A) Illustration of a Schwann cell culture at the time of the creation of the gap (T 0h) and 3 h later (T 3h). The dotted line indicates the initial inferior limit of the gap. Scale bars: 100 μm. B) Quantification of the colonization of the gap by Schwann cells transfected with Cthrc1 or control siRNAs. The covered areas were measured and normalized with the area invaded with control siRNA at T 9 h. Data represent mean ± s.e.m of duplicate cultures from three independent experiments and statistical significance of the difference was analyzed using the Student's t test: p<0.05 at 3 h and p<0.02 at 9 h.

