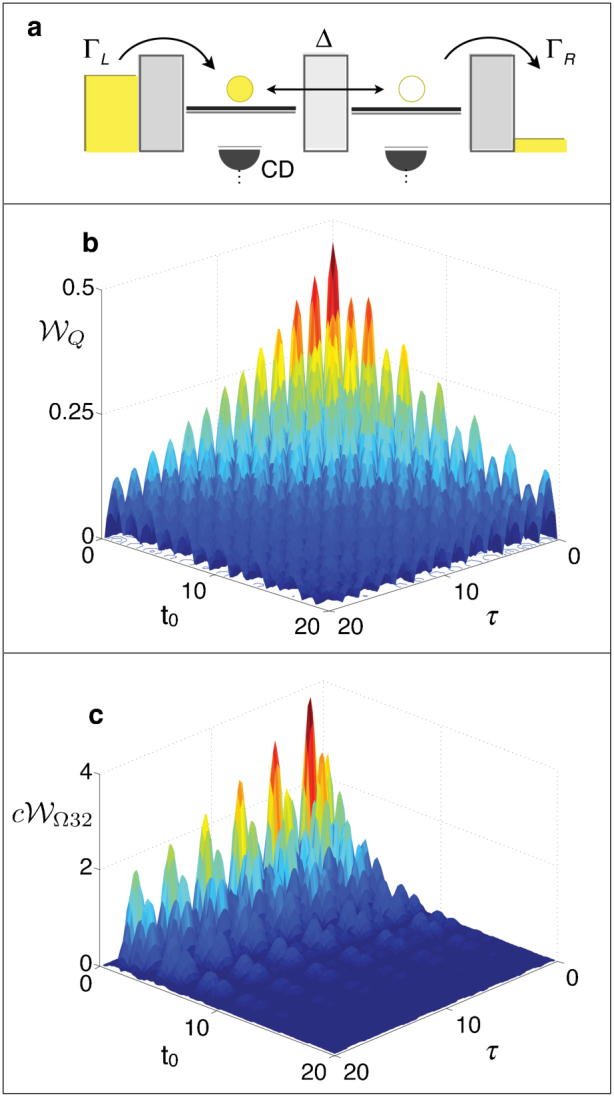
Figure 3. Detecting quantum transport through a double quantum dot.

(a) Schematic of a single-electron double quantum dot (DQD). Here we assume that the DQD is weakly coupled to leads under a large bias. Its Hamiltonian is HDQD = Δ(|L〉〈R| + |R〉〈L|) with the electron state basis {|L〉,|R〉,|0〉} where Δ is the tunnelling amplitude between the left-dot and right-dot electron states |L〉, |R〉. The transport between dots and leads is described by the self-energy,  , where sL = |0〉〈L|, sR = |R〉〈0|, and ΓL and ΓR are the left and right tunnelling rates, respectively. We assume charge detectors (CDs) are used for the measurements, but invasive current measurements are also sufficient (not shown here). (b,c) Verifying quantum transport through DQD with
  [Eq. (4) for t − t0 = τ] and
  [Eq. (6)], respectively. Here we define |0〉, |L〉, and |R〉 by |1〉, |2〉, and |3〉, respectively. For the setting ΓL = 4, ΓR = 0.1, and Δ = 1, the non-vanished
  and
and  indicate the quantum-transport regions, where c = (p1p2p3)−1 for the stationary state.
