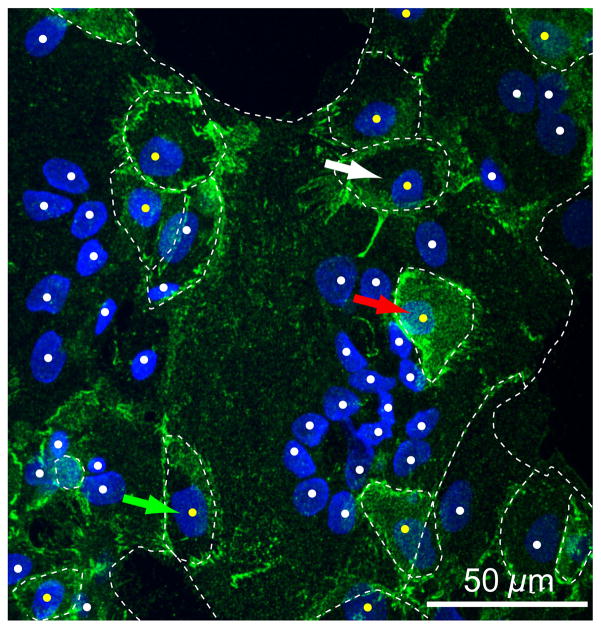
Figure 1. Structural relationships of cultured cytotrophoblasts and syncytiotrophoblast.
Shown is a maximal projection of confocal Z-stacks of primary human trophoblasts cultured for 76 h in 20% O2 and stained for E-cadherin (green) and DNA (blue). White dots indicate syncytiotrophoblast nuclei, which frequently appear clustered, and yellow dots indicate cytotrophoblast nuclei. White dotted lines indicate E-cadherin marking plasma membranes. Green arrow indicates a cytotrophoblast on the periphery of the syncytium, the red arrow indicates a cytotrophoblast that overlays the syncytium, and the white arrow indicates a cytotrophoblast within, and at the same focal plane, as the surrounding syncytium. See associated Supplementary movie 1.

