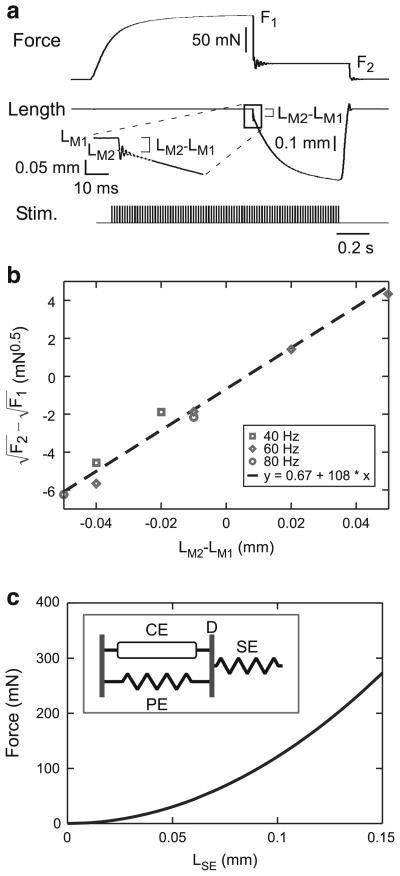
Fig. 4.
Initial length responses of activated muscles to rapid force changes. a The muscle’s motor nerve was stimulated with the muscle held at constant length until force reached steady-state. Counter force was then rapidly changed and the initial rapid muscle length change measured. The inset shows the oscillation and slope discontinuity used as the boundary between the initial and late muscle lengthenings (see Sect. 2.3). Initial length was 1.41 mm (rest length) and initial force 1.9 mN (true for all subsequent figures in which the initial length was rest length). b A linear fit was applied to a plot of versus LM2 − LM1 (see text for definitions). The slope of the fit equaled , where k3 is the proportionality constant relating muscle force and the length of the component of the muscle (LSE) responsible for the rapid length change. c A plot of muscle force using the model in the inset (in which muscle force equals FSE ), the quadratic series spring equation , and the mean k3 calculated for this muscle

