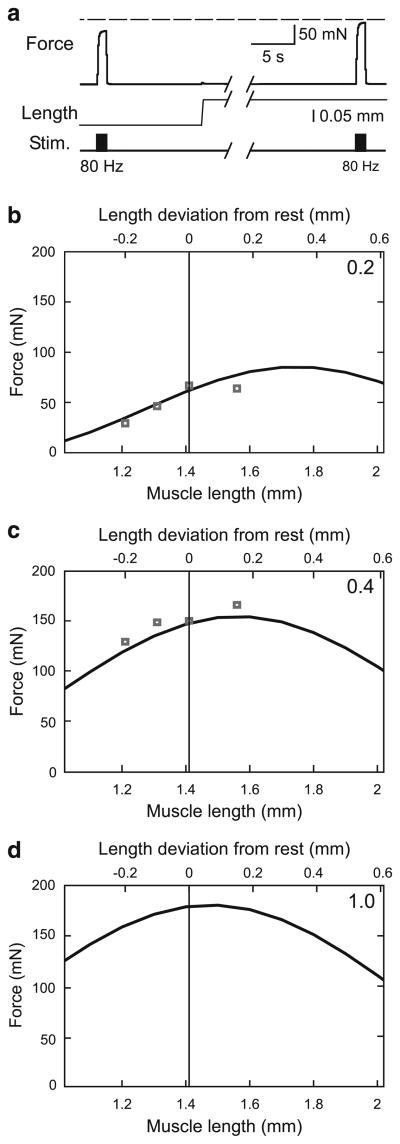
Fig. 7.
Experimental and fitting procedures used to calculate curvω from reduced number of experiments. a Muscle active force was measured at four muscle lengths at each of two activation levels (40 and 80 Hz); data shown here are for two muscle lengths at the 80 Hz activation level. Initial length was 1.21 mm, initial force was 0.2 mN. To compensate for changes in passive force resulting from the changes in muscle length, active force was calculated by subtracting passive force immediately before stimulation beginning from force during motor nerve stimulation. b, c Active force–length curves calculated from four muscle lengths (squares in two panels) at the two activation levels (numbers in upper right corner of each panel). See text for detailed explanation. Data points at rest length (1.41 mm) are means of three individual measurements at this length, one using the protocol shown in panel a and two from the forces before the force change in the force–velocity protocol shown in Fig. 8a. d Predicted force–length curve for an activation of 1 (200 Hz)

