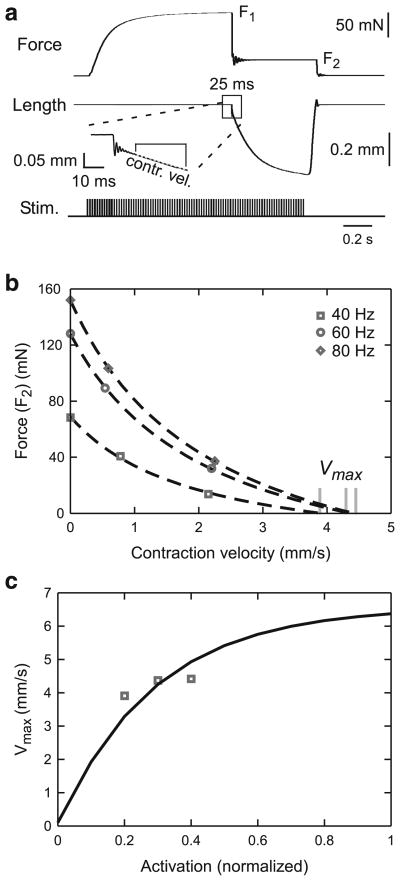
Fig. 8.
Determining νmax as a function of muscle activation. a The same quick release and quick stretch experiments as in Fig. 4a were used but the velocity immediately after the slope discontinuity (see inset) was used. Initial length was 1.41 mm (rest length). b Force versus contraction velocity for two force steps at each of three activation levels (and the relevant rest length isometric tetanic force for the ν = 0 points) were plotted and fit with a modified Eq. 17 (see text) to determine νmax at each activation level. c These νmax values were used to fit the νmax(act=1) term in Eq. 19

