
Figure 2.
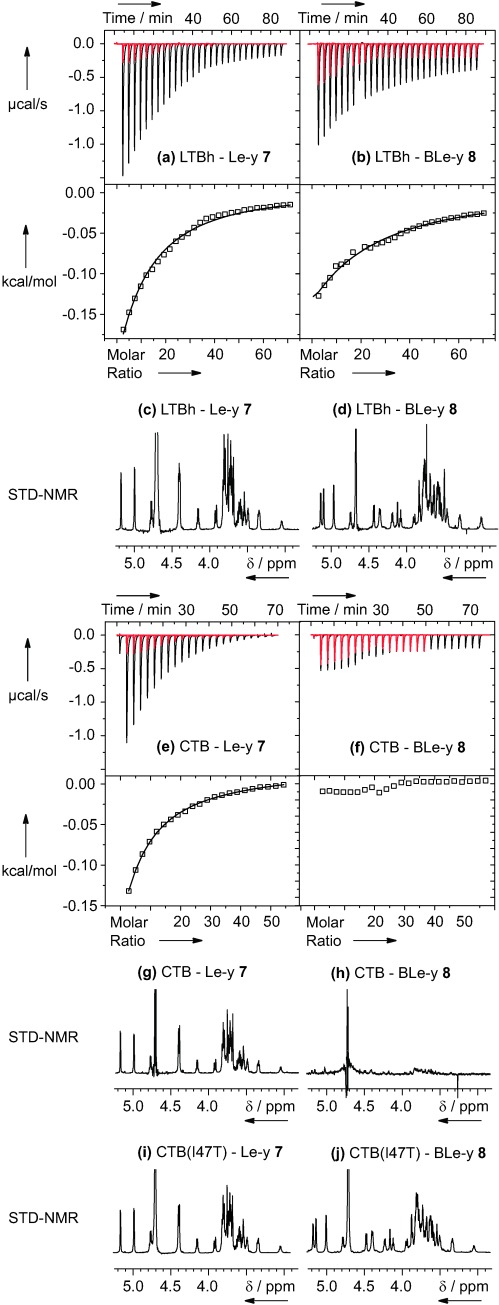
Representative examples of ITC experiments: a) Lewis-y 7 and b) B-Lewis-y 8 titrated into a mixture of LTBh (100 μm) and GM1os (200 μm); c) Lewis-y 7 and d) B-Lewis-y 8 titrated into a solution of El Tor CTB (100 μm). Raw titration data (black) and ligand dilution experiments (red) are shown in the top panels. Bottom panels display the integrated heat data with lines of best fit for each binding curve. c, d, g–j) Saturation transfer difference NMR (STD-NMR) spectra for each titration mixture.