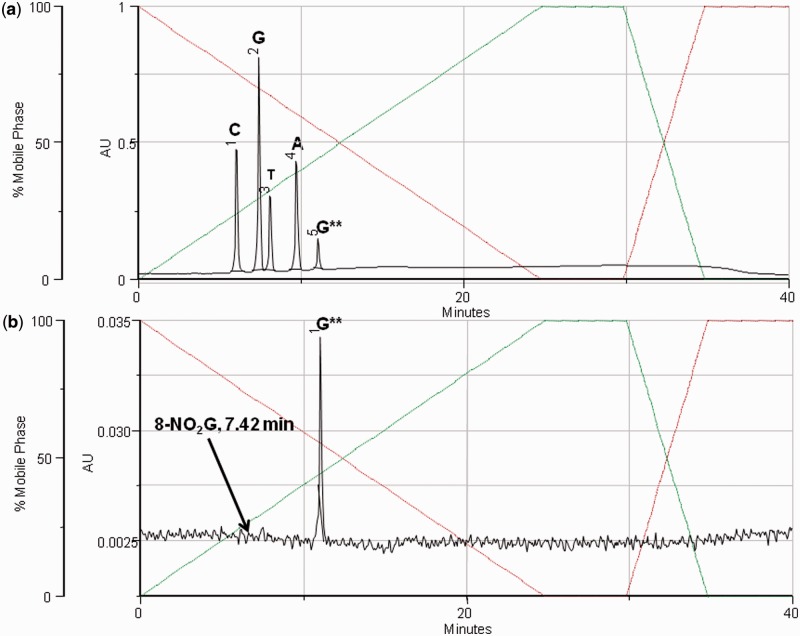
Figure 1.
Top trace shows the nucleoside composition analysis of GCGTACG**CATGCG obtained by enzymatic digestion with SVPD and alkaline phosphatase, followed by analysis by RP-HPLC at 260 nm. The bottom trace was recorded at 350 nm, where only 8-nitroguanine derivatives have a significant absorbance. The elution time for 8-nitroguanine is marked on the chromatogram. (G** = 8-nitro-2′-O-methylguanosine).

