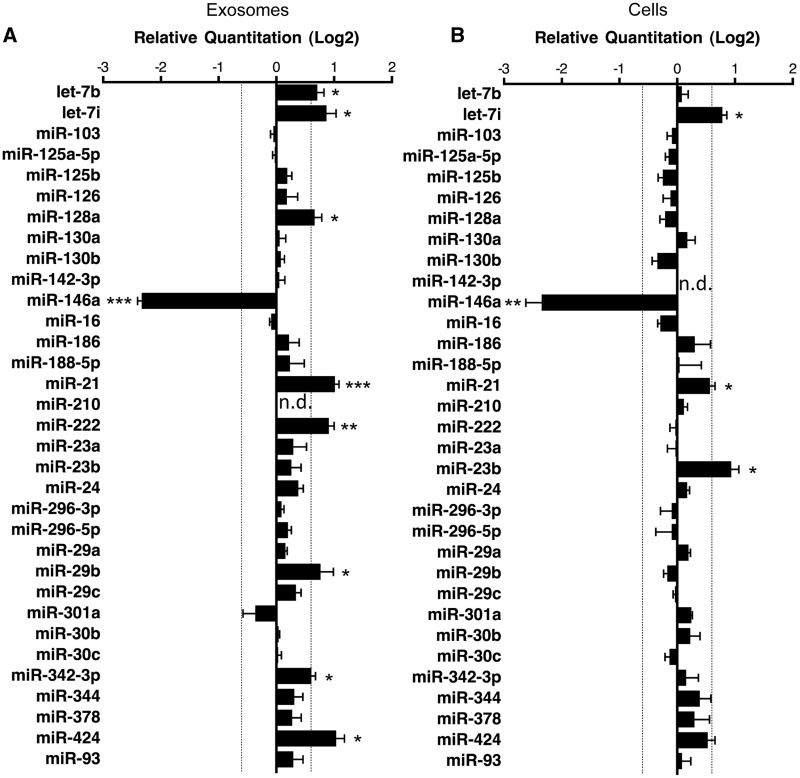
Figure 5.
Validation of miRNA ‘hits’ in infected exosomes and cells. (A) Exosomes miRNA detection by TaqMan qPCR miRNA assay, miR-210 was used as a negative control for exosomal miRNA. Relative quantitation data represent mean ±SEM normalized to sno135 and sno202 using ΔΔCt method. Fold change >1.5 or <1.5 is indicated with significance determined by Mann–Whitney U-test; *P < 0.05; **P < 0.01; ***P < 0.001 (n = 6–7 independent experiments, n.d. = not detected). (B) Cellular miRNA detection by TaqMan qPCR miRNA assay, miR-142-3 p was used as a negative control for cellular miRNA. Relative quantitation data represent mean ± SEM of normalized to sno135 and sno202 using ΔΔCt method. Fold change >1.5 or <1.5 is indicated by the dashed line with significance determined by Mann–Whitney U-test; *P < 0.05; **P < 0.01 (n = 6–7 independent experiments, n.d. = not detected).

