Figure 2.
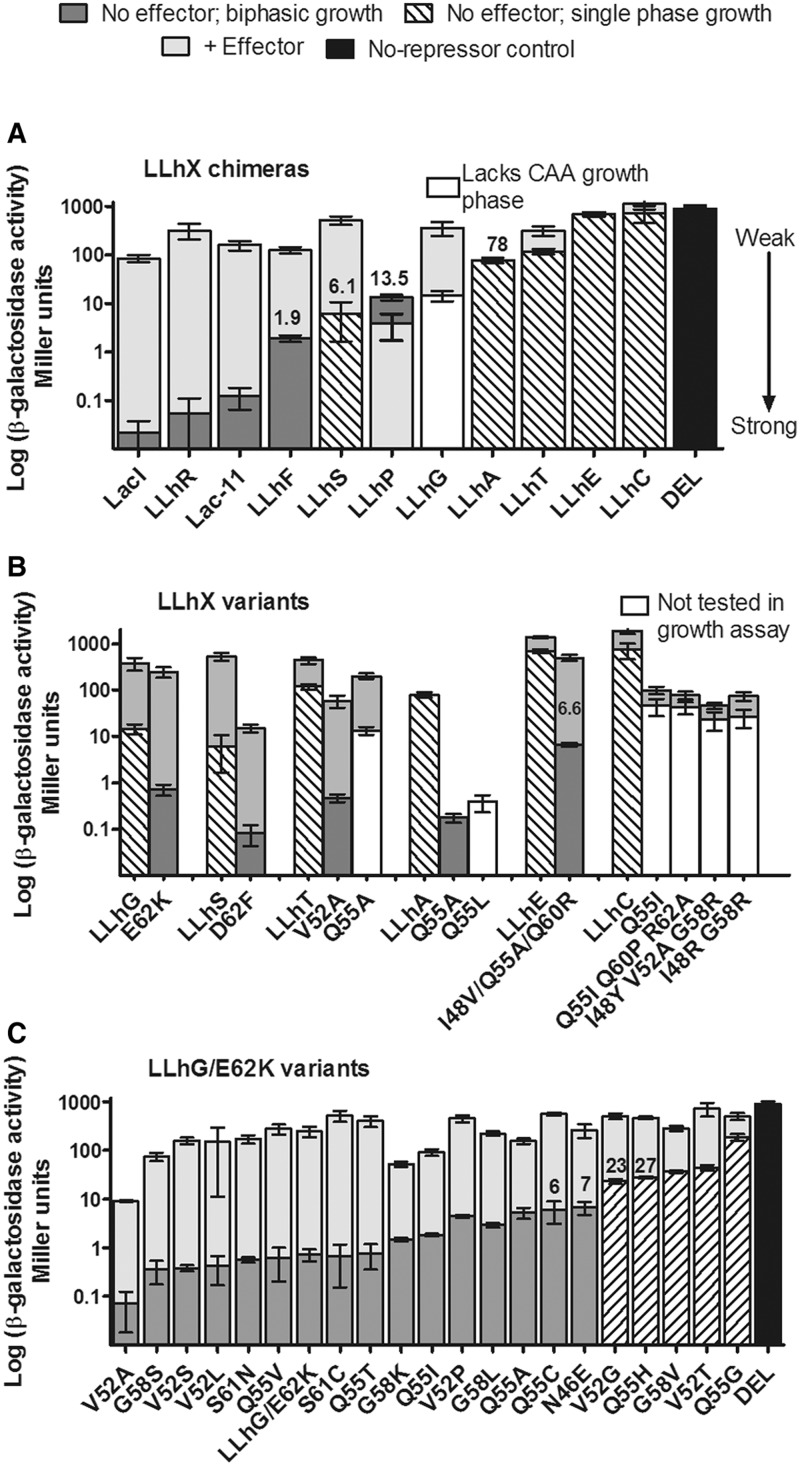
Repression of the lac operon by the (A) LLhX chimeras, (B) tight-binding LLhX variants and (C) LLhG/E62K variants. Transcription repression is inversely proportional to β-galactosidase activity; low bars correspond to stronger repression. In all panels, the dark gray, striped, and white bars show repression in the absence of effector. Dark gray and striped bars, respectively, correspond to the upper (biphasic growth) and lower (single phase growth) trends shown in Figure 6. For variants near the correlation gap in Figure 6, repression values are printed above the relevant bars. White bars are explained in the legends to panels A and B. The light gray bars depict repression in the presence of effector (Tables 1, 2 and Figure 1). For most chimeras, effector was added directly to the media; an upstream metabolite was used for LLhP (adenine), LLhF (fructose) and LLhT (trehalose). Most of the chimeras are induced by effector (repression is alleviated), but LLhP is co-repressed and repression is tighter in the presence of effector. LLhA has no known inducer. In panel B, note that none of the LLhC variants showed statistically significant induction or co-repression in the presence of cytidine when the effects of cytidine were taken into account (Supplementary Figure S2). The black bars show the ‘DEL’ β-galactosidase activity in the absence of repressor. The truncated LacI-11 variant is a dimer (23,90,91) and showed an expected decrease in in vivo repression relative to wild-type, tetrameric LacI. In panel C, many LLhG/E62K repression values were reported earlier (13) and are here shown on the same scale as panels A/B; new values are reported for N46E/E62K, Q55C/E62K, Q55H/E62K, Q55T/E62K, Q55V/E62K and S61C/E62K. All error bars indicate one standard deviation from the mean.

