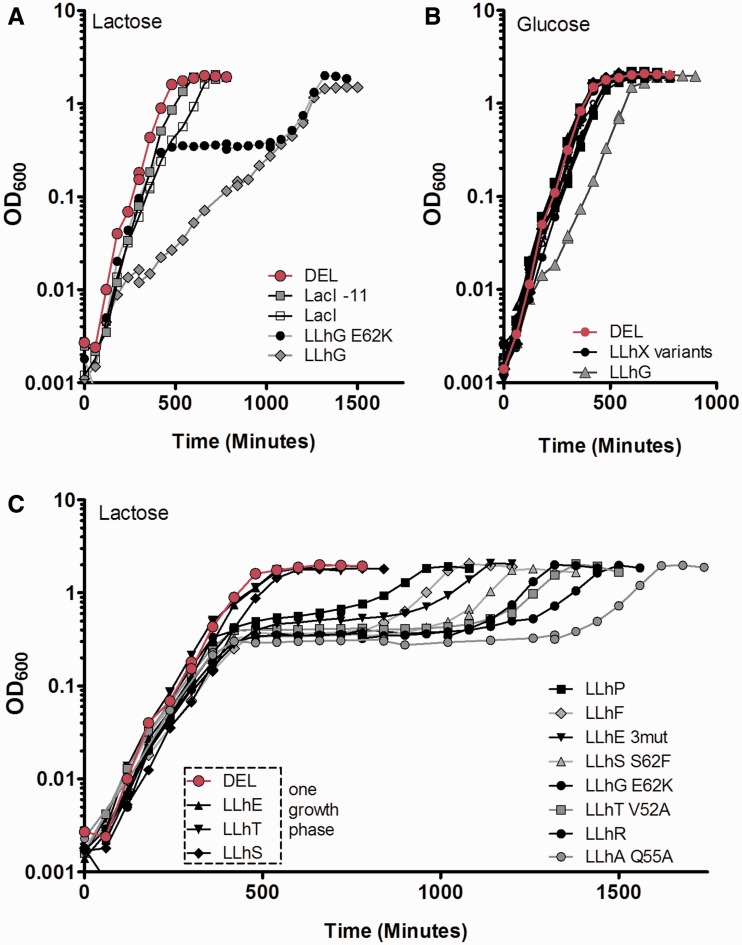
Figure 5.
LLhX growth curves in lactose and glucose minimal media. (A) Growth on lactose minimal media for E. coli cultures with the ‘DEL’ control (magenta), wild-type LacI, dimeric LacI-11, LLhG and LLhG/E62K. Note the biphasic growth curve for LLhG/E62K; the first phase is due to diauxic growth on CAA (Supplementary Figure S5). Cultures expressing LLhG (filled triangles) do not utilize CAA as a distinct carbon source. (B) Growth curves in glucose minimal media for ‘DEL’ (magenta) and LLhX chimera variants. LLhG growth on glucose (gray triangles) is slowed relative to the other cultures. (C) Growth curves in lactose minimal media for cultures expressing LLhX variants. LLhE ‘3mut’ comprises the triple mutant I48V/Q55A/Q60R. The ‘DEL’ control plasmid is shown with magenta diamonds.

