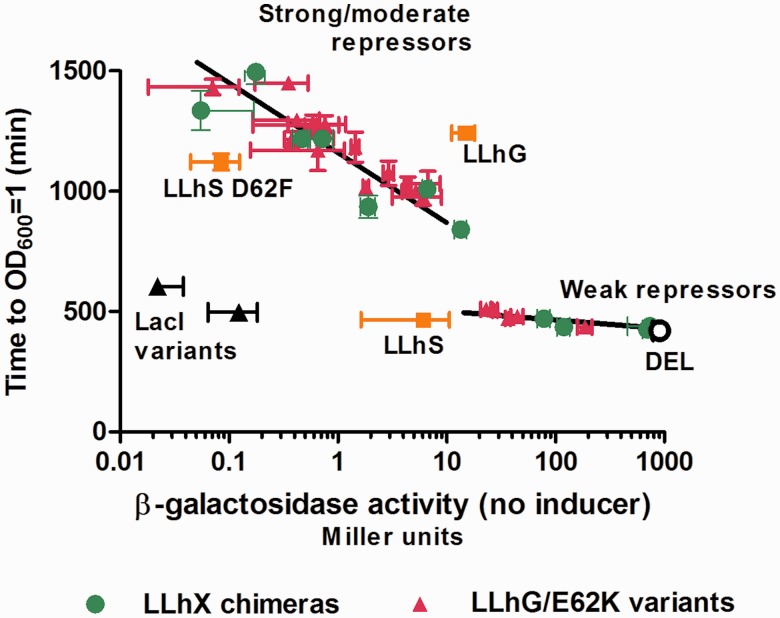
Figure 6.
Culture growth times correlate with repressor strength. Time to OD600 = 1 are plotted against log [β-galactosidase activity] for LLhG/E62K (magenta squares) and LLhX (green circles) variants. Data for LLhG, LLhS and LLhS D62F are indicated with orange squares. Results for wild-type LacI and dimeric LacI-11 are shown with black triangles; as expected, these repressors are quickly induced when lactose is converted to allolactose. Growth times are the average of at least three replicate experiments; error bars show the standard deviations. Black lines were drawn to aid visual inspection of the data.

