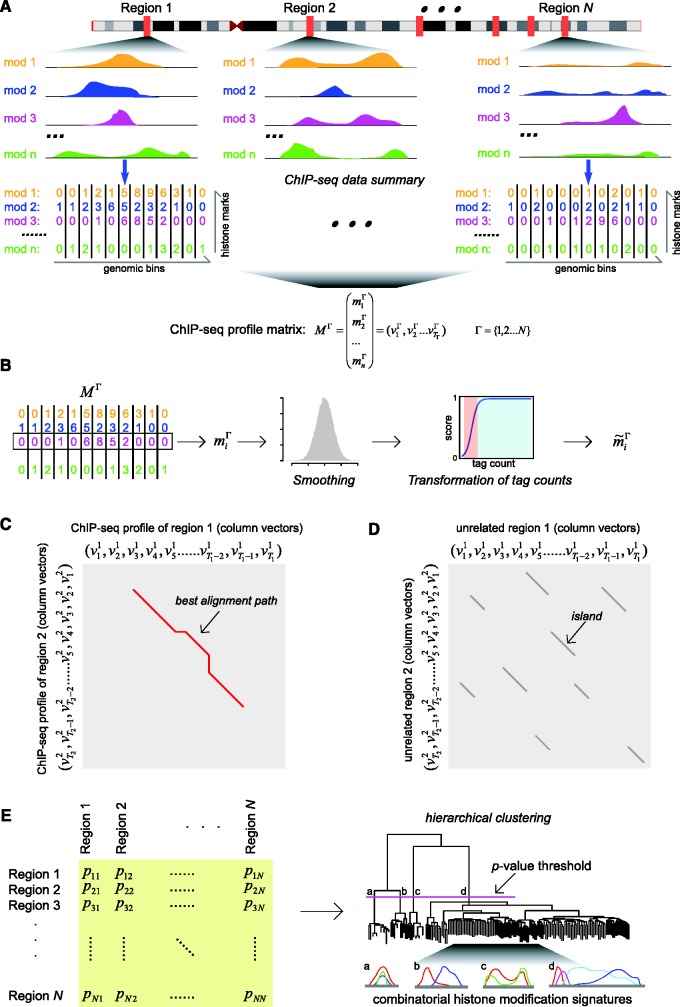
Figure 1.
Scheme of the ChAT algorithm. (A) For a series of  genomic regions, combinatorial histone modification distributions are represented by ChIP-seq profile matrices. Each genomic region under consideration is divided into 200 bp non-overlapping bins and each bin is associated with a column vector (
 ) summarizing the ChIP-seq tag counts for
  different histone modifications. The contiguous landscape of each individual histone modification along the genomic region is represented by the corresponding row vector (
 ). (B) Histone modification ChIP-seq tag counts are smoothed and transformed to produce normalized scores. (C) Dynamic programming is used to identify sub-regions with similar chromatin signatures. For each pair of genomic regions, a local dynamic programming algorithm is used to compare column vectors
  vs.
vs.  (i.e. the combinatorial histone modification signatures of individual genomic bins), and the best alignment path (red) is identified. (D) Pairwise P-values are computed based on a null distribution of high-scoring chromatin segment pairs (islands) found between unrelated genomic regions. Dynamic programming is used to identify high-scoring islands (grey lines), and the score distributions of the islands are used to estimate the parameters of extreme-value distributions for P-value calculation. (E) Pairwise P-values are organized into a distance matrix that is used for hierarchical clustering of similar chromatin sub-regions. The resulting tree of chromatin signatures can be partitioned using an explicit P-value threshold (purple line) to identify groups of related signatures.

