
Figure 10.
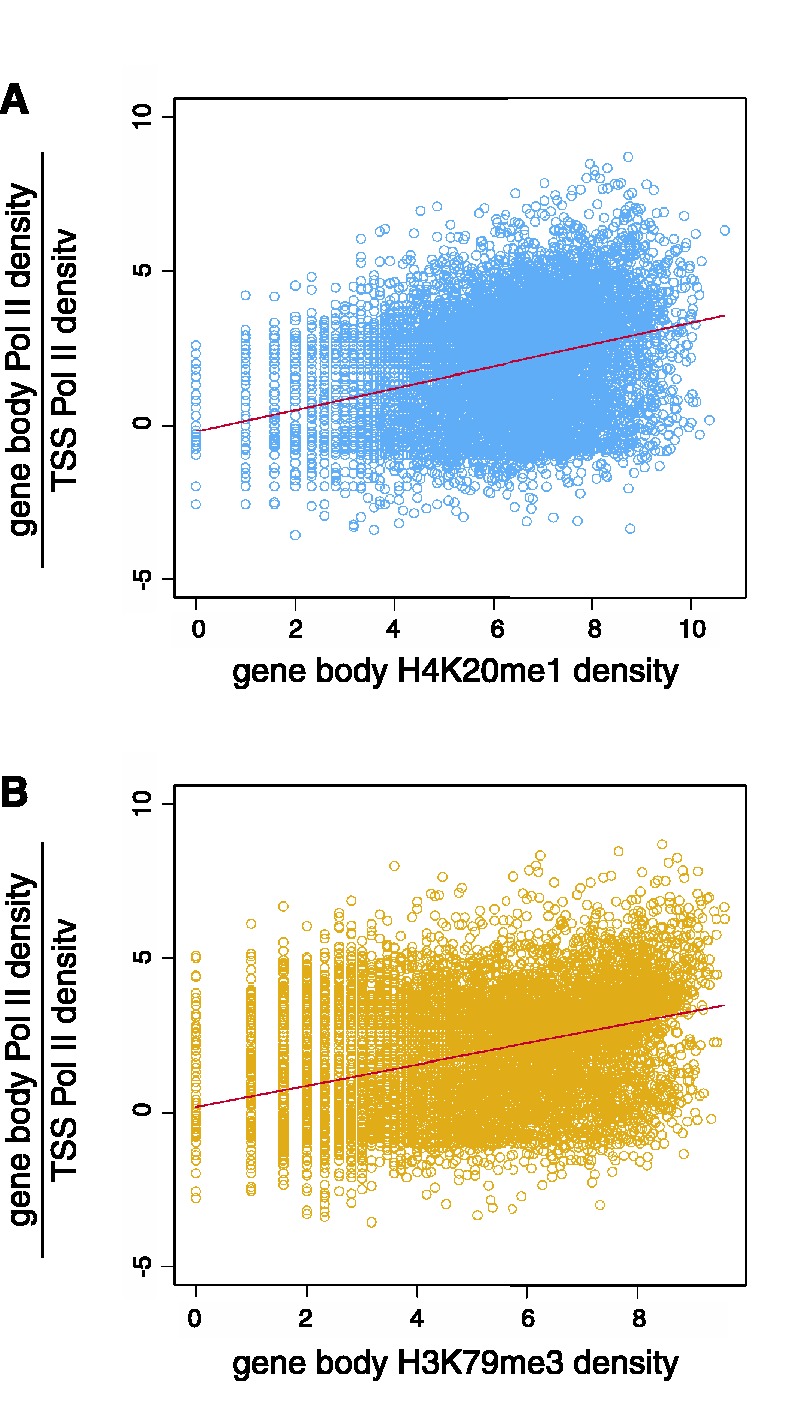
Transcriptional pause release associated with H4K20me1 and H3K79me3. The ratio of Pol II density downstream of TSS (+1 to +5 kb) over its density around TSS (−1 to +1 kb) is positively correlated with the density of downstream H4K20me1 (A, Spearman’s ρ = 0.54) and H3K79me3 (B, Spearman’s ρ = 0.51).