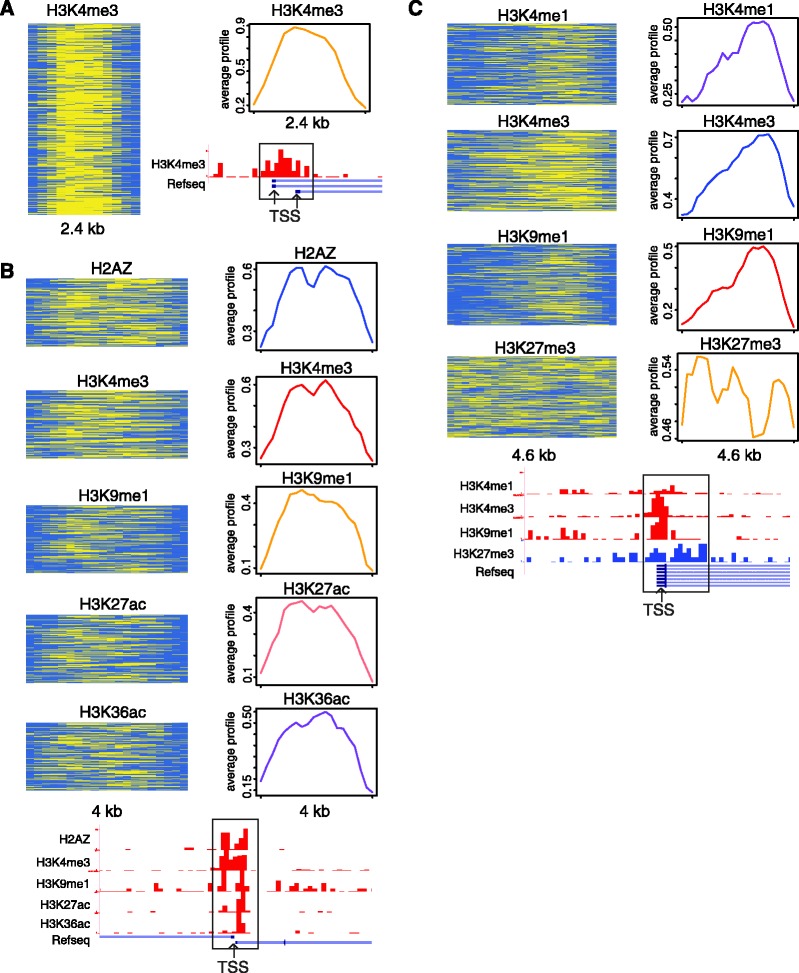
Figure 2.
TSS-associated chromatin signatures. (A) A TSS-associated signature based on enrichment of H3K4me3 is represented as a heatmap (yellow, high; blue, low levels of modification) and an enrichment profile showing the average modification scores across the signature. H3K4me3 tag counts (red) are shown for an instance of this signature at a human promoter locus. (B) A TSS-associated signature composed of five active histone modifications along with an example of this pattern seen at a divergent promoter locus. (C) A bivalent TSS-associated signature with three active modifications and one repressive modification (H3K27me3). Distributions of the active (red) and repressive (blue) histone modification tag counts are shown for a single promoter locus.

