
Figure 3.
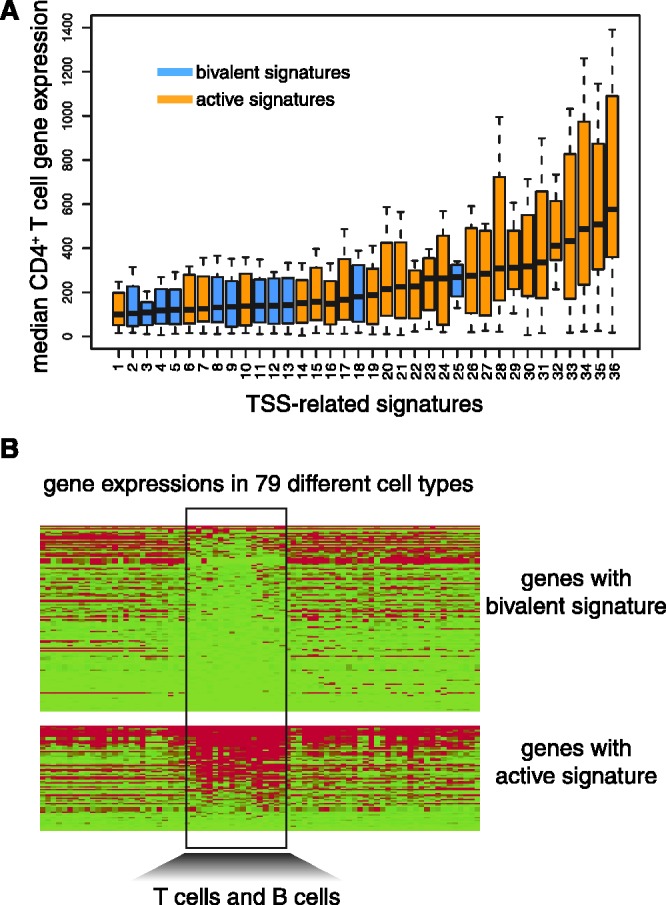
Differential gene expression associated with specific TSS chromatin signatures. (A) Median CD4+ T-cell expression levels (±1 quartile) of genes with TSS marked by 36 distinct chromatin signatures. Bivalent TSS signatures (blue bars) correspond to lower overall expression levels than active signatures (orange bars). (B) Cell-type specific gene expression patterns associated with different TSS chromatin signatures. Gene expression levels across 79 cell types (red, high; green, low) are shown for genes with TSS marked by a bivalent signature versus genes with TSS marked by an active signature. Expression differences are most pronounced for the indicated T cells and B cells.