Figure 6.
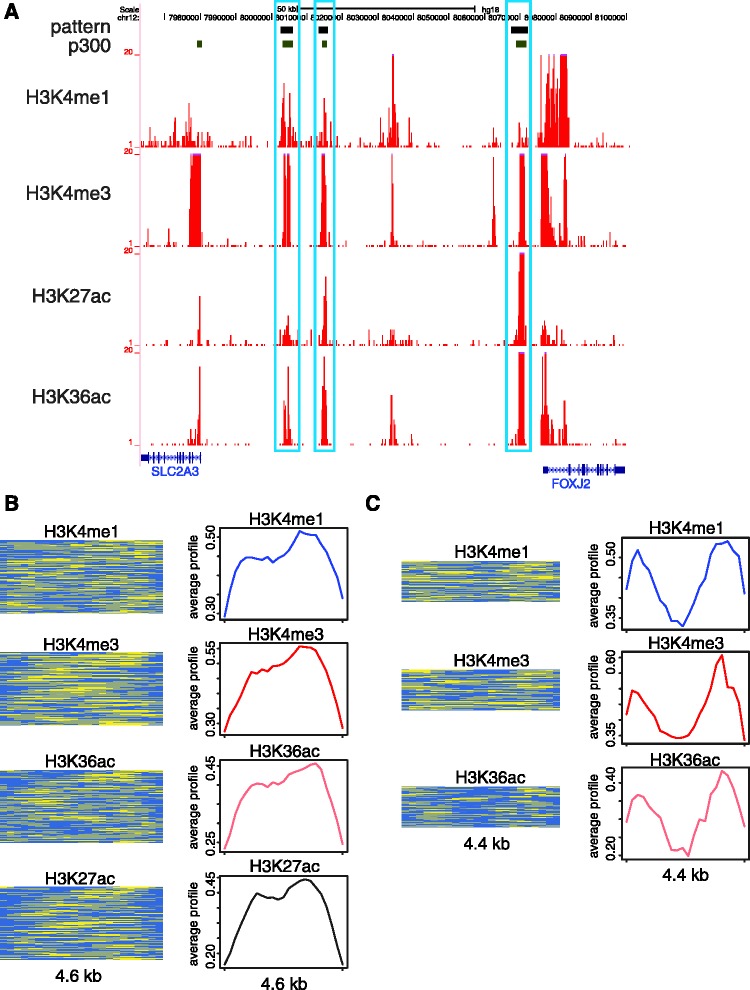
Enhancer-associated chromatin signatures. (A) ∼100 kb genomic region with three locations (black bars) marked by a specific enhancer-associated signature composed of co-located peaks of H3K4me1, H3K4me3, H3K27ac and H3K36ac (ChIP-seq tag counts in red). All of the three locations overlap with p300 binding sites. (B) Histone modification enrichment profiles of an enhancer-associated mono-modal signature. (C) Enrichment profiles of an enhancer-associated bi-modal signature. Histone modification representations are as described for Figure 2.

