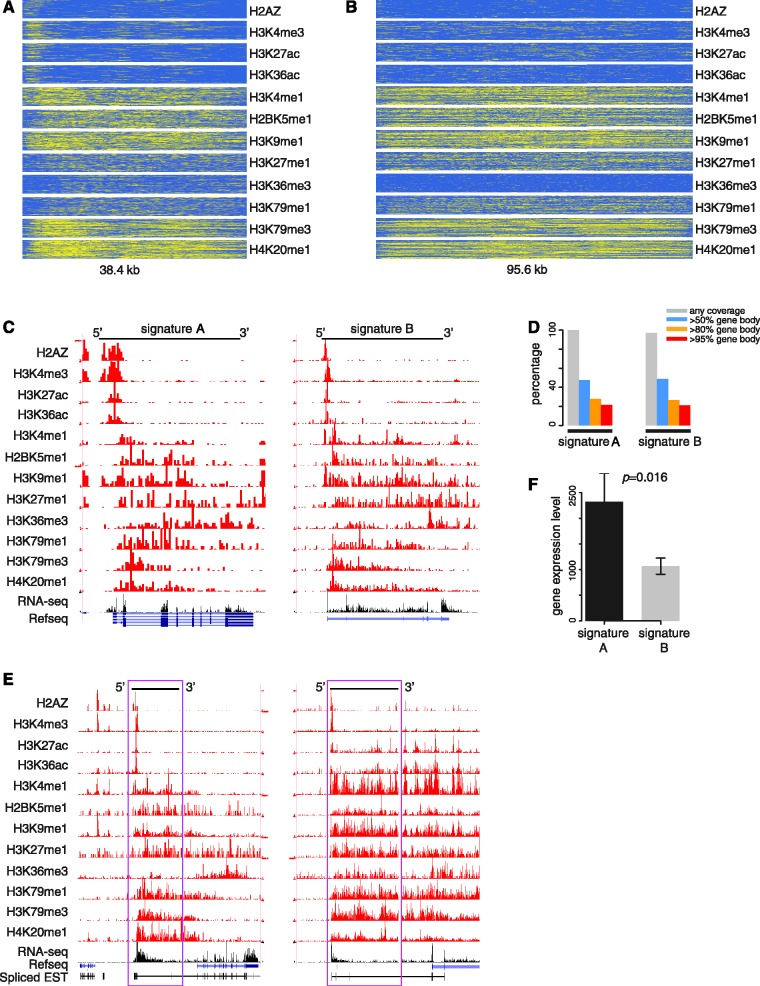
Figure 9.
Large-sized chromatin signatures associated with gene bodies. (A, B) Histone modification enrichment profiles (as described for Figure 2) are shown for two chromatin signatures composed of the same constituent modifications and spatial patterns with distinct sizes. (C) Specific instances of each signature co-located with human gene bodies are shown with modification ChIP-seq tag counts in red and RNA-seq tag counts in black. (D) Percentage of these two large-sized signatures that overlapping with gene bodies (grey, any coverage; blue >50% coverage; orange >80% coverage; red >95% coverage of the gene body). (E) Two examples where signature B is co-located with individual genomic regions that are annotated as intergenic but show evidence of being genic from RNA-seq and spliced EST data. (F) Average CD4+ T-cell expression levels for genes marked by signatures A and B.

