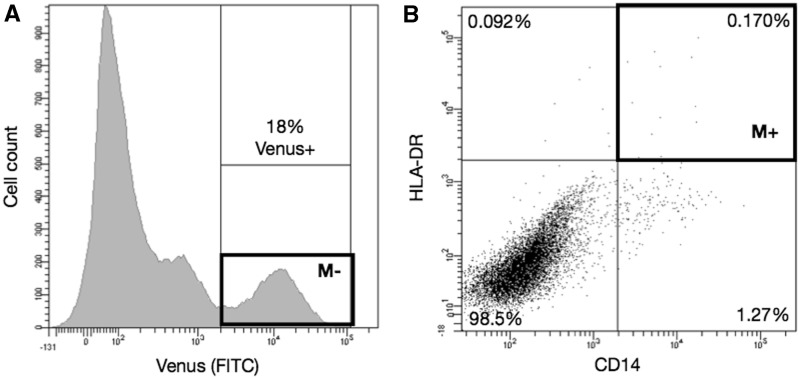
Figure 2.
Flow cytometry sorting of CD14 and HLA-DR-positive single cells. Two weeks post transduction of 18 monocyte-TMs, 18% of fibroblasts expressed Venus fluorescent protein (A, ‘M−’), out of which 0.17% was positive for both CD14 and HLA-DR markers (B, ‘M+’). Eighty-six single cells from M+ and M−boxes were sorted for further analysis.

