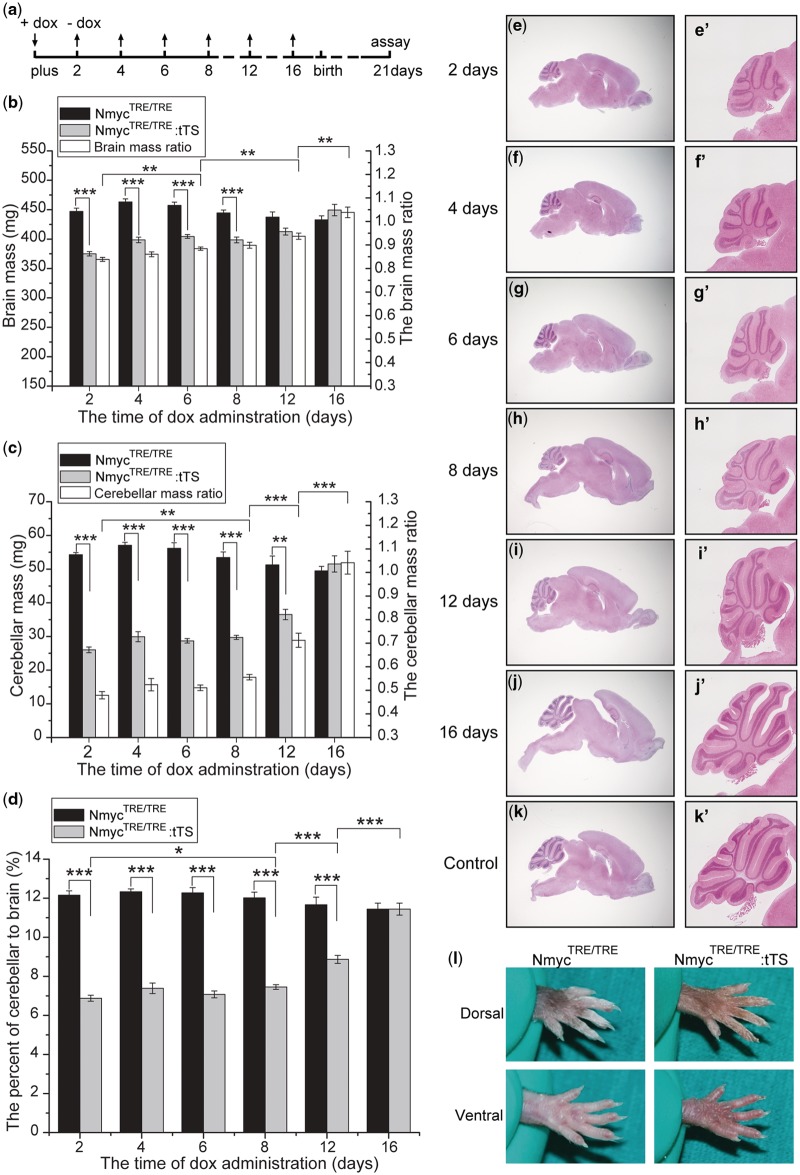
Figure 7.
Dox-regulated severity of cerebellar developmental defects. (a) Dox was added or removed from the drinking water of pregnant female mice at the indicated time points. (b–d) Absolute brain mass, absolute cerebellar mass and the ratio of cerebellar mass to total brain mass in mice exposed to dox for different durations (n = 5–9 for each genotype in the different exposure duration groups). Ratios in b and c are the ratios of total brain and cerebellar mass in NmycTRE/TRE:tTS mice to the NmycTRE/TRE mice with the same dox exposure. (e–k) Representative H&E staining of brain in mice exposed dox for different durations; (e′–k′) magnification of the cerebellum in e–k. e–j: brains from NmycTRE/TRE:tTS mice; k: the brain of NmycTRE/TRE mice. (l) Dorsal and ventral views of hindlimbs of 24-week mice from different genotypic classes with exposure to 2 mg/ml dox for 2 days since pregnancy (ANOVA; *P < 0.05; **P < 0.01; ***P < 0.001).

