
Figure 2.
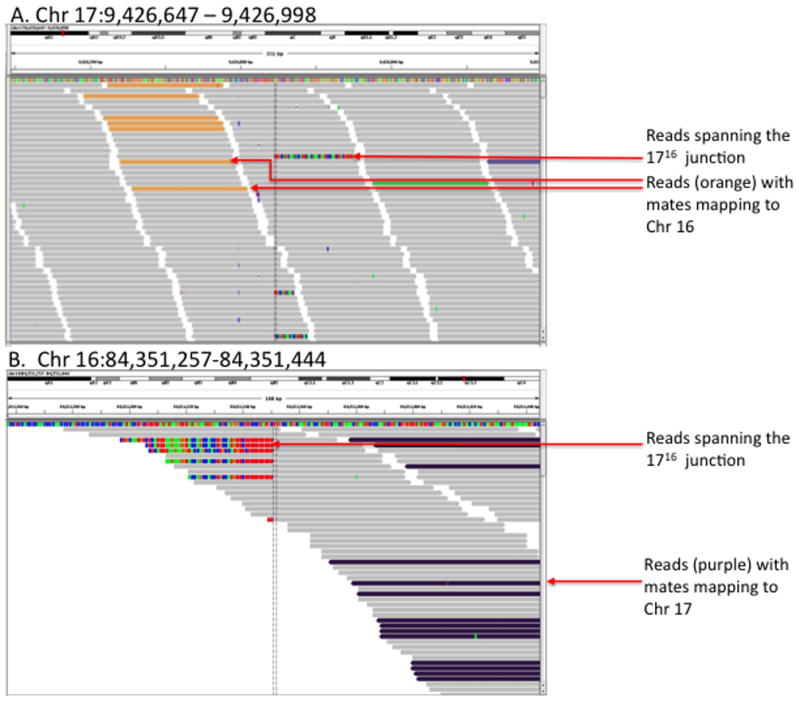
Visualization of reads aligning to the Chr 17 (A) and Chr 16 (B) breakpoint regions using the Integrated Genomics Viewer (IGV). Paired end reads mapping to Chr 17 with mates mapping to Chr 16 are shown in orange (A). Likewise, paired end reads mapping to Chr 16 with mates mapping to Chr 17 are shown in purple (B). Reads that map directly to the 1716 junction map either to Chr 17 or Chr 16, depending on the % of mismatches in the alignment (mismatches within the alignments are indicated in red, blue, green and orange).