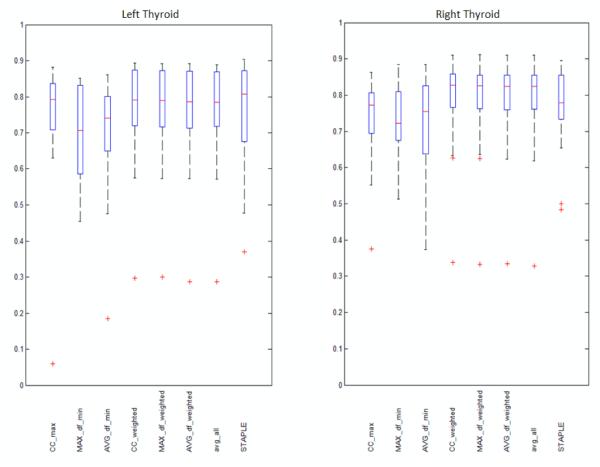
Figure 2.
Boxplots showing the sample minimum, Q1, Q2, Q3, and the sample maximum of volume DSC’s obtained using the most similar atlas selected by maximum CC (CC_max), minimum MAX_df (MAX_df_min) , and minimum AVG_df (AVG_df_min), the combination of all segmentation weighted by CC (CC_weighted), MAX_df (MAX_df_weighted), AVG_df (AVG_df_weighted), the average of all segmentations (avg_all), and the combination of all segmentations by STAPLE. Left panel: Left thyroids. Right panel: Right thyroids.

