
Figure 3.
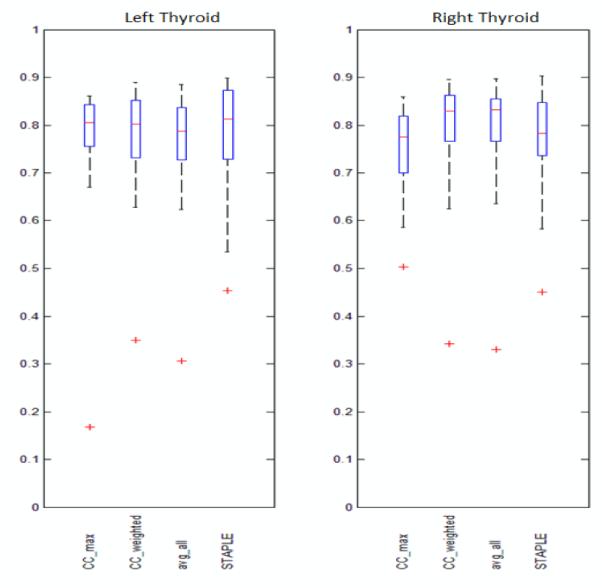
Boxplots showing the sample minimum, Q1, Q2, Q3, and the sample maximum of the averages of slice DSC’s obtained using CC_max, CC_weighted, avg_all, and STAPLE. Left panel: Left thyroids. Right panel: Right thyroids.
Official websites use .gov
A
.gov website belongs to an official
government organization in the United States.
Secure .gov websites use HTTPS
A lock (
) or https:// means you've safely
connected to the .gov website. Share sensitive
information only on official, secure websites.
Boxplots showing the sample minimum, Q1, Q2, Q3, and the sample maximum of the averages of slice DSC’s obtained using CC_max, CC_weighted, avg_all, and STAPLE. Left panel: Left thyroids. Right panel: Right thyroids.