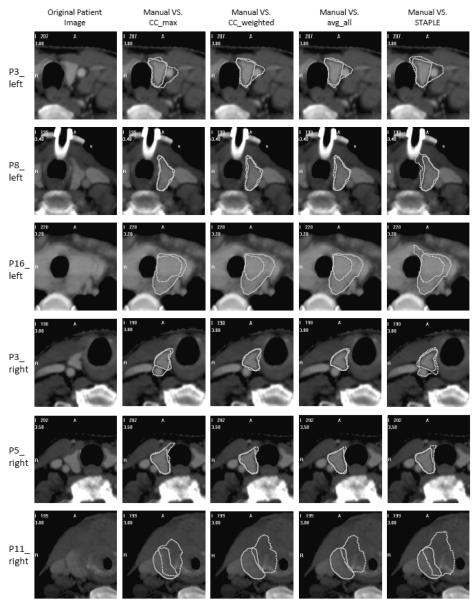
Figure 5.
Segmentations obtained using the four representative methods shown in contours with dotted lines compared with the manual segmentation shown in solid lines. For each row, from the left to the right: The original patient image, images with contours obtained using CC_max, CC_weighted, avg_all, and STAPLE compared with the manual contours. Rows from top to bottom: Left thyroids for patients 3, 8, and 16, right thyroids for patients 3, 5, and 11.

