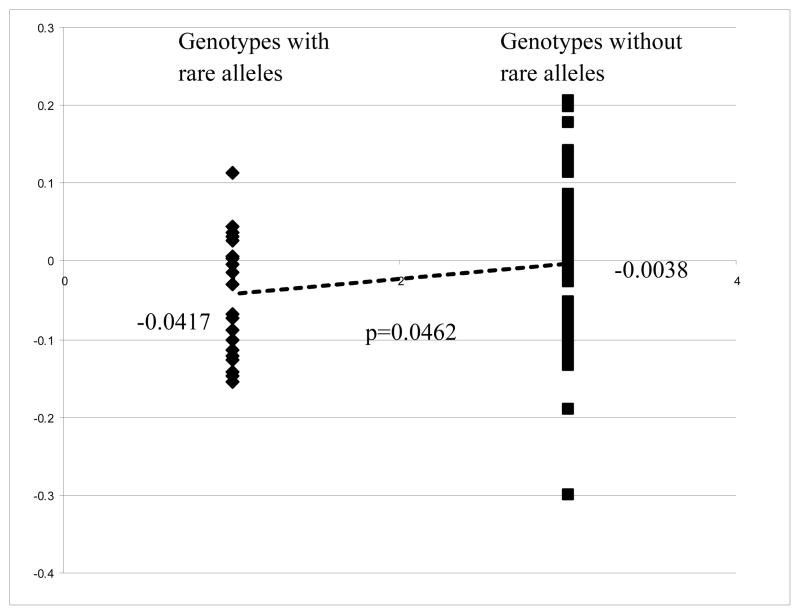
Figure 3.
Correlation of allele genotype of significant SNPs with SOD1 mRNA expression profiles. Expression profiles of SOD1 mRNA for CEPH cell lines were downloaded from Gene Expression Omnibus (GEO) dataset GDS1048 (Monks and others, 2004). The genotypes of the selected SNPs of SOD1 in the study for CEPH DNA we obtained were generated by SNPlex platform and 69 CEPH samples were matched to the GDS1048 dataset for analysis. We are comparing a group of 22 samples present with one or more rare alleles of the four significant SNPs (rs202446, rs202447, rs4816405, and rs2070424) to another group of 47 samples without rare allele in their genotypes. Expression level of SOD1 (NM_000454) mRNA was normalized using the expression level of GAPDH mRNA of individual sample before analysis. We perform Student t-test to compare expression of the two groups and a p-value <0.05 is considered significant.

