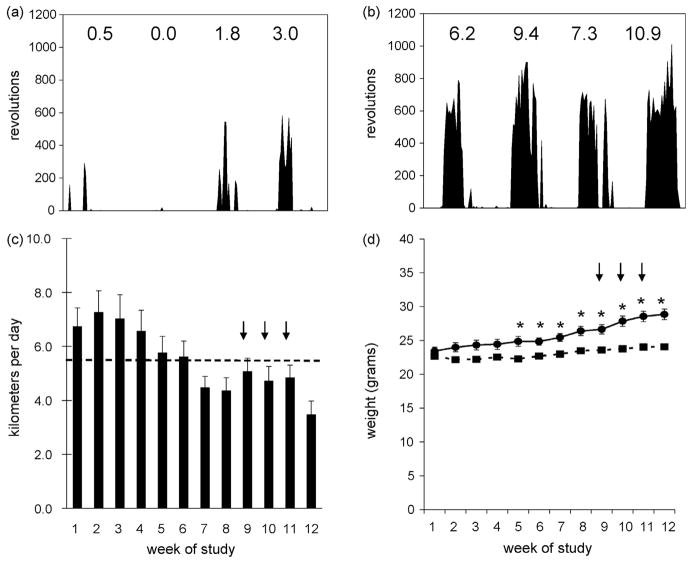
Fig. 1.
Individual histograms from 2 representative female C57BL/6 mice demonstrate the heterogeneity in running activity. (a) Running activity in 1 mouse that exhibited (a) low running activity and (b) high running activity over the 4-day test period. The average km/day run by each mouse in (a & b) are shown above the histogram plots. (c) Among mice selected for the study, the average km/day run was 5.5 km/day (dashed line) during the 12-week study (n=26). (d) Average weekly body weights of AL (●) or AL+EX (■) mice (n=26/group). Arrows indicate the administration of primary and booster vaccinations. Asterisks indicate significantly different body weights between AL and AL+EX groups (P<0.05).

