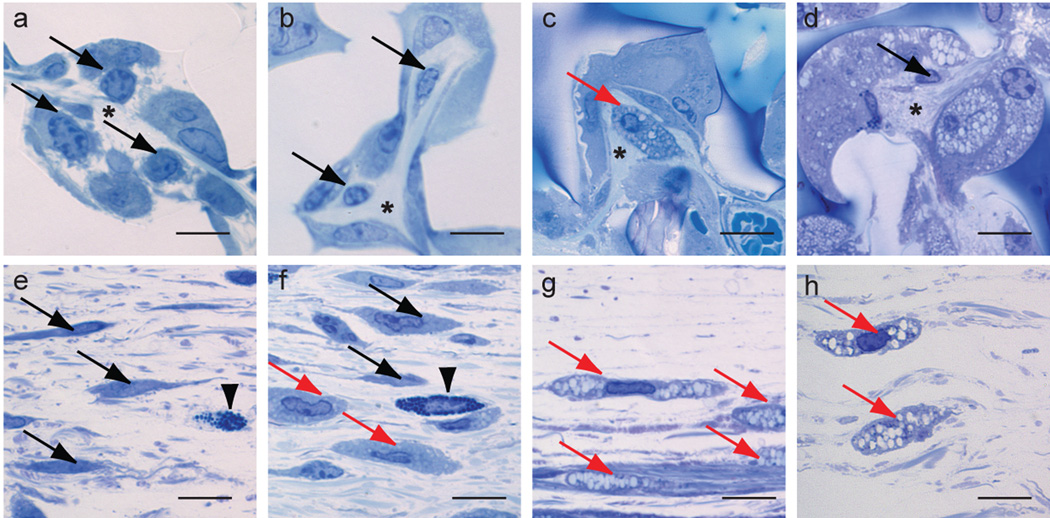
Figure 6.
Richardson’s stained sections of 14-day (a,e), 1-month (b,f), 3-month (c,g) and 6-month (d,h) implants. Fibroblasts are shown within the pores (a–d) and in the fascia of the tissue surrounding the implants (e–g) (black arrows (non-vacuolated fibroblasts), red arrows (vacuolated fibroblasts). Arrowheads indicate mast cells, asterisks indicate collagen. Mag bar = 10 µm.

