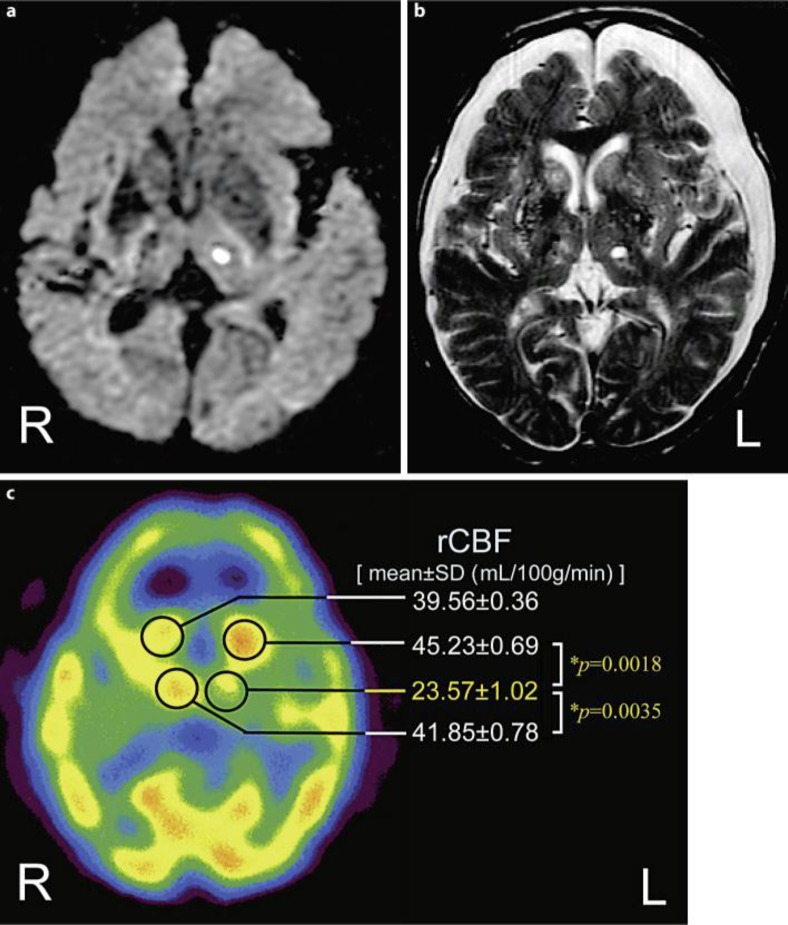
Fig. 2.
The findings of neuro-imaging. The results of the MRI study are shown in a and b. The 99mTc-ECD SPECT study result is shown in c (performed on day 18 after admission). a Axial section of the initial DWI (TR: 6,000, TE: 100), performed on admission. b Axial section of the follow-up T2-WI (TR: 4,500, TE: 90), performed on day 14 after admission. c Axial image of 99mTc-ECD-SPECT. The rCBF was quantified using a fully automated analysis software, FineSRT. The rCBF data are described as mean ± SD (in milliliters per 100 grams per minute). A significant decline of rCBF in the left thalamus (23.57 ± 1.02) was demonstrated compared with those in the right (41.85 ± 0.78; * p = 0.0035) and in the left head of the caudate nucleus (45.23 ± 0.69; * p = 0.0018).

