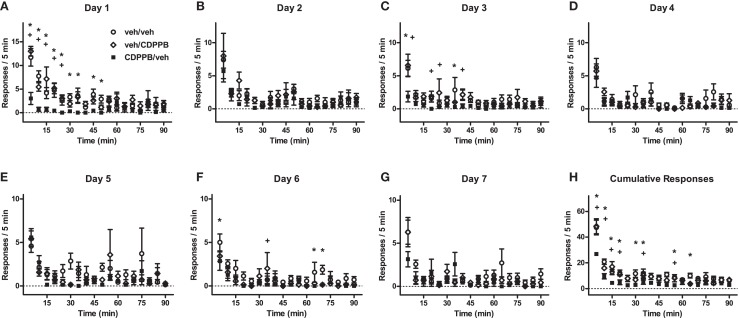
Figure A2.
Time-binned linear analysis of extinction behavior in Experiment 2. (A–G) Mean (±SEM) number of active lever responses from Days 1–7 of the first extinction training sequence, and (H) the per-subject average (±SEM) of cumulative responses, which were categorized into 5-min bins and analyzed with mixed factorial ANOVA. *p < 0.05 difference between veh/veh and CDPPB/veh groups (post hoc Newman–Keuls tests). +p < 0.05 difference between veh/CDPPB and CDPPB/veh groups (Newman–Keuls tests).

