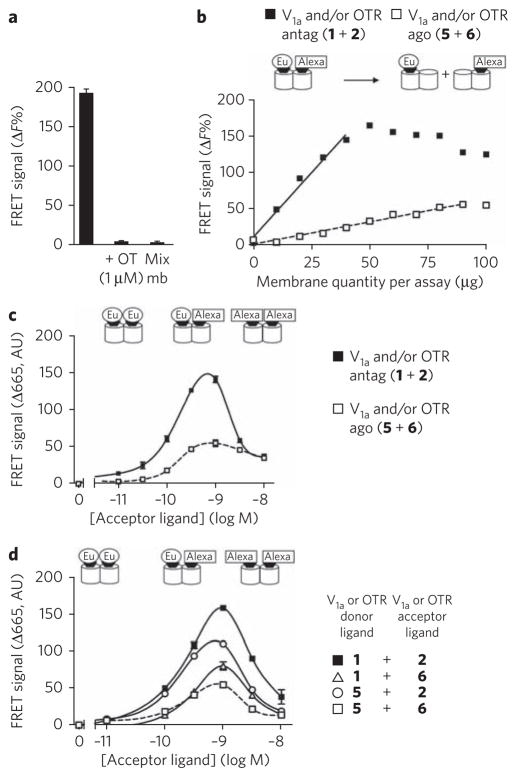
Figure 4. FRET signals between fluorescent antagonists or agonists bound to native oxytocin receptors expressed in rat mammary glands.
(a) Membrane preparations were labeled with [Lys8(Eu-PBBP)]PVA (1) (1 nM) and [Lys8(Alexa-647)]PVA (2) (1 nM). To produce negative controls, an excess of oxytocin (1 μM) was added or membrane samples labeled with either ligand 1 or 2 were mixed (Mix mb). Notably, membrane samples were mixed just before the reading of the fluorescent signal. (b) Effect of membrane quantity of lactating rat mammary gland on the FRET signals measured between fluorescent agonists (5 and 6) (1 nM) (white squares) compared to those obtained with antagonists (1 and 2) (1 nM) (black squares). (c) Variation in the FRET signal as a function of antagonist (black squares) or agonist (white squares) concentration. Donor ligands [Lys8(Eu-PBBP)]PVA (1) and HO-[Thr4,Orn8(Eu-PBBP)]VT (5) were used at 1.2 nM and 1.5 nM, respectively. (d) Comparison of FRET signals obtained with the various pairs of ligands. Donor ligands were used at 1 nM. Acceptor ligand corresponds either to ([Lys8(Alexa-647)]PVA (2); black squares and white circles) or (HO-[Thr4,Orn8(Alexa-647)]VT (6); white squares or triangles). Illustrated data are representative of at least three independent experiments performed in triplicate. Values correspond to the mean ± s.e.m. AU, arbitrary units.

